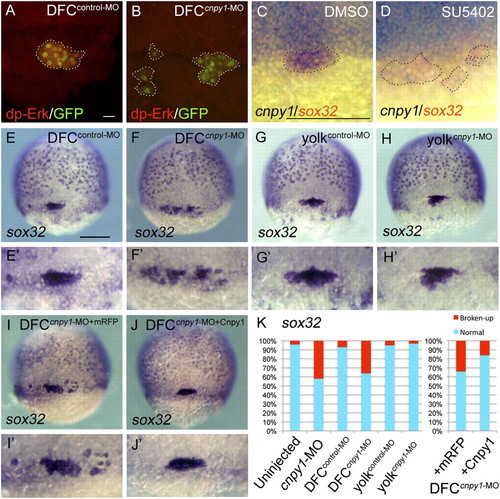
Cnpy1 within DFCs regulates DFC clustering. (A and B) dp-Erk staining in DFCcontrol-MO–injected (A) or DFCcnpy1-MO–injected (B) Tg[sox17:GFP] embryos at 60% epiboly stage. (Scale bar: 20 μm.) dp-Erk signals (red) were down-regulated in GFP-positive DFCs (green). (C and D) cnpy1 (purple) and sox32 (red) expression in DMSO-treated (C) or SU5402-treated (D) embryos at 60% epiboly stage. (Scale bar: 200 μm.) Dotted lines in A–D mark the outlines of DFC populations. (E–J) sox32 expression in DFCcontrol-MO (E), DFCcnpy1-MO (F), yolkcontrol-MO (G), yolkcnpy1-MO (H), DFCcnpy1-MO+mRFP (I), or DFCcnpy1-MO+Cnpy1 (J) embryos at 70% epiboly stage. Dorsal view, anterior to the top. (Scale bar: 200 μm.) (E2–J2) Higher-magnification images highlight DFCs. (K) Percentages of normal (clustered) or broken-up DFCs were scored by using the sox32 expression pattern in uninjected (n = 68), cnpy1-MO (n = 77), DFCcontrol-MO (n = 61), DFCcnpy1-MO (n = 78), yolkcontrol-MO (n = 56), yolkcnpy1-MO (n = 62), DFCcnpy1-MO+mRFP (n = 119), or DFCcnpy1-MO+Cnpy1 (n = 123) embryos. Statistically significant (P < 0.05) differences could be seen in uninjected versus cnpy1-MO, DFCcontrol-MO versus DFCcnpy1-MO, and DFCcnpy1-MO+mRFP versus DFCcnpy1-MO+Cnpy1 embryos.
|
