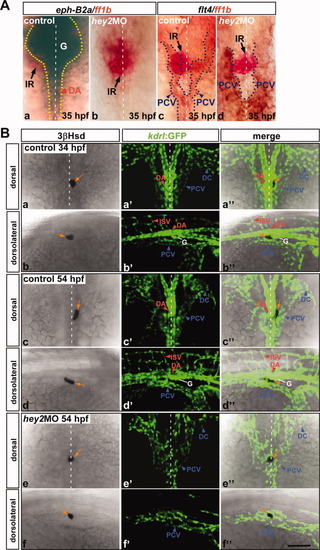
Effects of the hey2 antisense morpholino injection on the interrenal tissue and its neighboring vasculature. A: Ventral flat-mount views showing the effects of hey2MO on the expressions of eph-B2a and flt4 in the peri-interrenal region. Uninjected control (a,c) and injected embryos (b,d) were fixed at 35 hpf, and two-color ISH were carried out to detect the expression of ff1b together with either eph-B2a (a,b) or flt4 (c,d). a-d: Oriented with anterior to the top. B: Confocal images display the interrenal tissue as detected by 3 β-Hsd activity staining (left panels, a-f), and the neighboring endothelium as labeled by green fluorescence (middle panels, a′-f′), of 34-hpf (a,b) and 54-hpf (c-f) Tg(kdrl:EGFP)s843 embryos uninjected (a-d) or injected with hey2 antisense morpholino (e,f). The merged images of 3 β-Hsd activity staining and GFP are shown in the right panels (a″-f″). Each fluorescent image depicting the vascular morphology represents a projection of a consecutive z-stack encompassing the depth of the interrenal tissue. a-a″, c-c″, e-e″ are dorsal views with anterior oriented to the top, while b-b″, d-d″, f-f″ are dorsolateral views with anterior to the right. Relocalization and right-sided laterality of the interrenal tissue is perturbed upon the disruption of axial artery in the hey2 morphant. Black and orange arrows indicate the ff1b-expressing and steroidogenic interrenal tissues, respectively. Red and blue arrowheads denote the arterial and venous vasculature, respectively. Yellow and blue dotted lines, boundaries of arterial and venous structures, respectively; white dotted lines, position of the midline; DA, dorsal aorta; ISV, intersegmental vessel; PCV, posterior cardinal vein; DC, duct of Cuvier; G, glomerulus; IR, interrenal tissue. Scale bar = 50 μM.
|
