
FIGURE
Fig. S1
Fig. S1
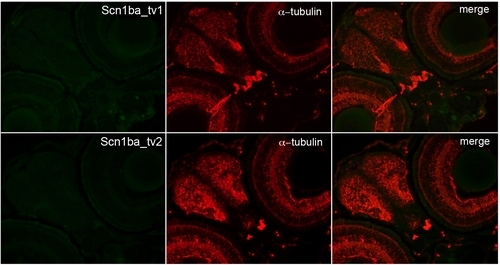
Antibody characterization. Immunohistochemical analysis of anti-Scn1ba_tv1 (top panel) or anti-Scn1ba_tv2 (lower panel) antibody (green) staining following pre-adsorption to its corresponding antigenic peptide. Sections were co-stained with anti-acetylated α-tubulin (red). Merged panels on the right. |
Expression Data
Expression Detail
Antibody Labeling
Phenotype Data
Phenotype Detail
Acknowledgments
This image is the copyrighted work of the attributed author or publisher, and
ZFIN has permission only to display this image to its users.
Additional permissions should be obtained from the applicable author or publisher of the image.
Full text @ BMC Genomics