Fig. 4
- ID
- ZDB-FIG-050317-3
- Publication
- Kedinger et al., 2005 - Spatial and temporal distribution of the traf4 genes during zebrafish development
- Other Figures
- All Figure Page
- Back to All Figure Page
|
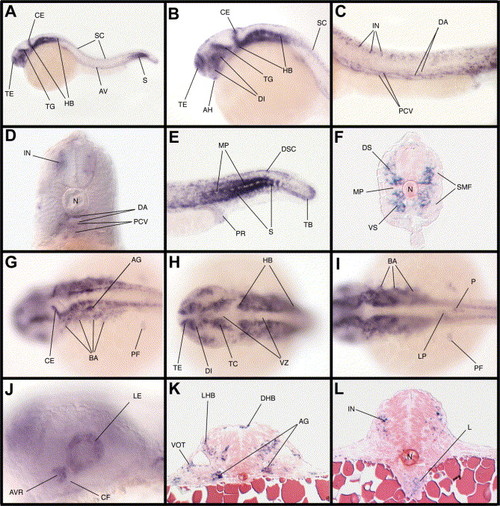
Expression of traf4a at 24 and 36 hpf. (A) At 24 hpf, traf4a expression is detected in the telencephalon (TE), tegmentum (TG), cerebellum (CE), hindbrain (HB), spinal cord (SC), somites (S) and the axial vasculature (AV). (B) Higher magnification of the same embryo showing the same territories of expression than in (A), additional expression can be detected in the diencephalon (DI) and the adenohypophyse (AH). (C) High magnification of the trunk region of the embryo in (A) showing expression in interneurons (IN), in the dorsal aorta (DA) and in the posterior cardinal vein (PCV). (D) Thick section of the same embryo at the level of the trunk confirming the expression of traf4a in the interneurons, the dorsal aorta and the posterior cardinal vein. (E) High magnification of the tail region showing expression of traf4a in the dorsal spinal cord (DSC), the somites (S), the proctoderm (PR) and the tail bud (TB). Traf4a is excluded from the muscle pioneers (MP). (F) Histological transverse section at the level of the tail pointing out that traf4a is expressed in the dorsal part (DS) and in the ventral part (VS) of the somites but is excluded from the muscle pioneers (MP) and from the slow muscle fibers (SMF). (G–I) At 36 hpf, traf4a transcripts are present in the cerebellum (CE), the telencephalon (TE), the diencephalon (DI), the tectum (TC), the hindbrain (HB), the branchial arches (BA), the statoacoustic ganglia (AG), the pectoral fins (PF), the liver primordium (LP) and the pancreas (P), but are excluded from the central nervous system ventricular zone (VZ). (J) Focus on the eye of an embryo at 36 hpf showing an expression of traf4a in the lens (LE) and in the anterior ventral retina (AVR) just in front of the choroïd fissure (CF). (K) Histological section highlighting the staining in the ventral otic vesicles (VOT), in the statoacoustic ganglia (AG), in the lateral hindbrain (LHB) and in the dorsal hindbrain (DHB). (L) Histological section at the level of the anterior spinal cord focusing on the expression of traf4a in the interneurons (IN) and in the liver (L). (A–C,E,J) lateral views, (H,I) dorsal views, (G) oblique view. In each panel, anterior is to the left. (D) thick section, (F,K,L) histological transverse sections. N, notochord; NT, neural tube. |
| Gene: | |
|---|---|
| Fish: | |
| Anatomical Terms: | |
| Stage Range: | 26+ somites to Prim-15 |
Reprinted from Gene expression patterns : GEP, 5(4), Kedinger, V., Alpy, F., Tomasetto, C., Thisse, C., Thisse, B., and Rio, M.C., Spatial and temporal distribution of the traf4 genes during zebrafish development, 545-552, Copyright (2005) with permission from Elsevier. Full text @ Gene Expr. Patterns

