
- Title
-
An activated form of type I serine/threonine kinase receptor TARAM-A reveals a specific signalling pathway involved in fish head organiser formation
- Authors
- Renucci, A., Lemarchandel, V., and Rosa, F.
- Source
- Full text @ Development
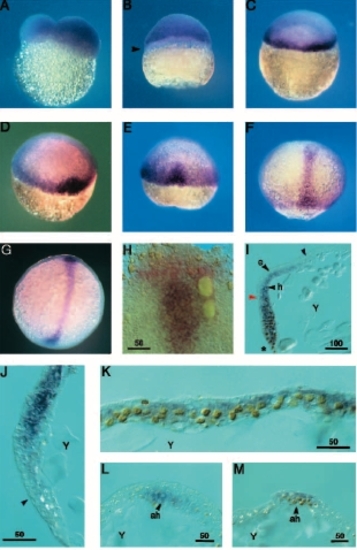
(A-G) TARAM-A RNA expression in early zebrafish embryos stages. Whole-mount view from lateral (A-C), or dorsal (D-G) side; (A-F) animal pole is to the top; (G,H) anterior is to the top. (A) 2-cell-stage. (B) 500-cell stage. TARAM-A expression is fading from the marginal cells corresponding to the prospective yolk syncitial layer cells (YSL) (arrowhead). (C) Dome stage. TARAM-A expression is no longer detected in animal pole cells and is restricted to the marginal zone. (D) 40% epiboly stage. An additional domain of TARAM-A appears on the future dorsal side. (E) Shield stage. The expression in the marginal zone is fading and the TARAM-A territory expression occupies the shield area. (F) 80% epiboly stage and (G,H) 100% epiboly stage; labelling is restricted to the embryonic axis. (H) Flat-mount view of head of an embryo at the end of gastrulation labelled with gsc (red) and TARAM-A (purple). The anterior limit of TARAM-A expression is bordered by the anterior, crescent-shaped gsc domain. (I-M) Sections of embryos labelled with a TARAM-A probe (blue) and an anti-NTL antibody (nucleus in yellowish brown). (I-K) Sagittal section; (L,M) cross sections. Y indicates the position of the yolk, the black arrowheads indicate the positions of the epiblast (e) and the hypoblast (h) or axial hypoblast (ah). (I) Sagittal section through a 70% epiboly stage embryo; the asterisk indicates the blastoderm margin, the red arrowhead indicates the anterior boundary of NTL protein distribution and the blue arrowhead the anterior boundary of TARAM-A expression in the hypoblast (dorsal to the left). Brachet’s cleft, delimiting the hypoblast-epiblast boundary, is visible in the anterior part of the embryo (Kimmel et al., 1995). (J,K) Sagittal section through the head (J), or the trunk (K), of a 95% epiboly stage embryo, (J, anterior down). The head can be divided into three regions. Anterior to the blue arrowhead, where the crescent-shaped expression of gsc is detected (see H), no TARAM-A expression is detected. Posterior to the blue arrowhead, both hypoblast and epiblast weakly express TARAM-A. More posteriorly, strong TARAM-A expression is graded, with peak levels around hypoblast-epiblast boundary. Periderm is not labelled. (K; anterior left) The axial hypoblast corresponding to the future notochord expresses specifically ntl and is labelled by TARAM-A. In addition to the hypoblast the epiblast is labelled. (L,M) Transverse sections through the head (L) and the trunk (M) of a 95% epiboly stage embryo. Staining is axial in both cases. Values for scale bars are indicated in μm. |
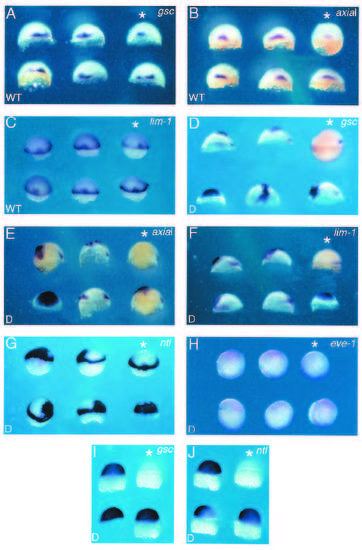
In vivo analysis of TARAM-A and TARAM-A-D activities; expression of mesodermal markers (indicated in the upper right corner of each picture) in zebrafish late blastula (50% epiboly) (A-H), or high-blastula stage (3.5 h) (I,J). Embryos were injected at the 1- or 2-cell stage into the animal pole region with TARAM-A-WT (200 mg/ml), or with TARAM-A-D at 0.1 or 2 mg/ml. The asterisk indicates non-injected control embryo. (A-C) Expression of gsc, axial and lim-1 respectively upon TARAM-A-WT overexpression (dorsal view). TARAM-A-WT induces an enlargment or a local duplication of the gsc, axial and lim-1 domains in the shield area. (D-G) Expression of TARAM-A-D RNA (0.1 or 2 mg/ml) induces in varied locations large and thickened ectopic dorsal mesoderm (side view, dorsal to the left). In each case, one embryo injected with 2 mg/ml RNA is included and exhibits expression of the marker in the entire blastoderm. Expression of TARAM-A-D RNA (0.1 or 2 mg/ml) does not induce ectopic expression of a ventral marker eve-1 (H), (animal pole view, dorsal to the top). At 50% epiboly, eve-1 follows an arch of 180° on the marginal zone opposite the dorsal side. This arc is slightly reduced in injected embryos (the pink staining corresponds to the lineage tracer coinjected with the RNA). (I,J) Early onset of gsc and ntl expression in high blastula following injection of TARAM-A-D RNA. Induced expression is visible before the endogenous expression can be detected particularly for ntl RNA. |

Duplication of anterior structures in TARAM-A-D-injected embryos. (A-C) TARAM-A-D RNA was injected at 0.1 mg/ml into a marginal cell from 16-cellstage embryos. Embryos are observed after 24 hours, three specimens with duplication of anterior structures are shown. (A) A complete duplication of the head is observed, the two heads are facing each other (side view). (B) The two heads are contiguous (dorsal view). (C) One additional eye in a frontal position is observed. (D,E) Fate of TARAMA- D-expressing cells using coinjection of the rhodamine dextran lineage tracer (D), or the b-gal RNA tracer (40 μg/ml) (E), into one marginal cell of a 16-cell-stage embryo. (D) Left side view from the head and trunk of three 48-hour embryos (anterior to the left). The hatching gland (arrowheads) and head mesendoderm are strongly fluorescent. The apparent labelling of the yolk ball is due to light refraction. (E) Left side view from three 24-hour embryos stained for β-gal activity. Hatching glands (arrowheads) and head mesendoderm display strong β-gal activity. Some scattered periderm cells as well as undifferentiated tailbud cells are also labelled. |