
- Title
-
Llgl1 mediates timely epicardial emergence and establishment of an apical laminin sheath around the trabeculating cardiac ventricle
- Authors
- Pollitt, E.J.G., Sánchez-Posada, J., Snashall, C.M., Derrick, C.J., Noël, E.S.
- Source
- Full text @ Development

Llgl1 promotes organised trabeculation and ventricular wall integrity. (A-J) Live light-sheet z-slices through the ventricle of Tg(myl7:LifeAct-GFP) transgenic wild-type and llgl1 mutant embryos visualising the myocardium at 120 hpf (A-E) and 80 hpf (F-J). Scale bars: 50 μm. Wild-type embryos have regular trabeculae emerging predominantly from the outer curvature of the ventricular wall at 120 hpf (A), whereas llgl1 mutant embryos exhibit disorganised trabeculae, ranging from wild-type-like (B), through to irregular trabecular CMs and multilayering of CMs (C-E). Some llgl1 mutants at 120 hpf exhibit apically extruding CMs (arrow, E). At 80 hpf in llgl1 mutants, CMs extrude apically from multiple locations in the ventricular wall (arrows G-J). (K) Quantification of extruding cell number in wild-type siblings and llgl1 mutant embryos at 55 hpf (wt, n=11; llgl1−/−, n=11), 80 hpf (wt, n=15; llgl1−/−, n=27) and 120 hpf (wt, n=6; llgl1−/−, n=19). (L) Distribution of extruding cells in wild-type and llgl1 mutant embryos at 80 hpf. Schematic depicts the location of the outer curvature (OC), ventricular apex (VA), outflow tract (OFT) and inner curvature (IC) in the ventricle. Comparative analysis performed using one-way ANOVA (****P<0.0001). ns, non significant. Box plots show median values (middle bars) and first to third interquartile ranges (boxes); whiskers indicate 1.5× the interquartile ranges; dots indicate data points. |

Llgl1 is required for timely apical redistribution of Crb2a. (A-D) Confocal z-slices of the ventricle of Tg(myl7:LifeAct-GFP) transgenic embryos visualising the myocardium (green) and anti-Crb2a antibody (magenta). (A′-D′) Crb2a staining. Scale bars: 25 µm. C and D show higher magnification of yellow boxes in A and B, respectively. Scale bars: 10 µm. In wild-type embryos at 72 hpf low levels of Crb2a are distributed across the apical myocardial membrane (A,C), whereas in llgl1 mutants bright Crb2a puncta are observed at apical CM junctions (B,D). (E-F’) Example measurements of Crb2a in wild-type and llgl1 mutant embryos. (G) Schematic showing quantification of Crb2a across the apical CM surface. AM, apical membrane; Ap, apical; Ba, basal; J, junction. (H,I) Example quantifications of Crb2a intensity across the standardised apical membrane of individual cardiomyocytes in wild type (H) and llgl1 mutants (I) at 72 hpf. Crb2 is elevated at the cell boundaries in llgl1 mutants (I) compared with wild type (H). Individual traces represent individual embryos. Grey boxes indicate apicobasal positions used to bin data into junctional domains. (J) Quantification of junctional/apical Crb2a intensity in wild-type siblings and llgl1 mutants at 55 hpf (wt, n=139; llgl1−/−, n=113), 72 hpf (wt, n=117; llgl1−/−, n=106) and 80 hpf (wt, n=112; llgl1−/−, n=159). At 72 hpf wild-type embryos have slightly elevated Crb2a at CM junctions compared with across the apical membrane, but llgl1 mutants have significantly more junctional Crb2a. By 80 hpf, overall levels of Crb2a in llgl1 mutants is reduced compared with wild-types. One-way ANOVA with multiple comparisons (****P<0.0001, **P<0.01, *P<0.05). ns, non significant. Box plots show median values (middle bars) and first to third interquartile ranges (boxes); whiskers indicate 1.5× the interquartile ranges; dots indicate data points. (K) Schematic depicting dynamics of Crb2a distribution in wild type and llgl1 mutants at 72 hpf and 80 hpf. |
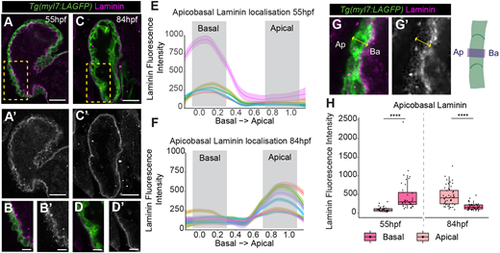
Laminin deposition shifts from basal to apical ventricular surface. (A-D′) Confocal z-slices of the ventricle of Tg(myl7:LifeAct-GFP) transgenic embryos visualising the myocardium (green) and anti-laminin antibody (magenta). A-D show a merge view, A′-D′ show laminin staining. Laminin is deposited on the luminal basal myocardial surface at 55 hpf (A,A′), but is enriched on the apical exterior surface of the myocardium at 84 hpf (C-D′). Scale bars: 25 µm. B and D show a magnification of the yellow boxed areas in A and C, respectively. Scale bars: 10 µm. (E,F) Example quantifications of laminin intensity across the standardised apicobasal axis of individual CMs at 55 hpf (E) and 84 hpf (F). Grey boxes indicate apicobasal positions used to bin data into apical/basal domains. (G,G′) Example images and schematic showing method for quantifying laminin across the apicobasal CM axis. Ap, apical; Ba, basal. (H) Quantification of laminin fluorescence intensity at apical and basal positions in ventricular CMs at 55 hpf and 84 hpf. Each point represents an individual cell (55 hpf, n=38; 84 hpf, n=48). One-way ANOVA with multiple comparisons (****P<0.0001). Box plots show median values (middle bars) and first to third interquartile ranges (boxes); whiskers indicate 1.5× the interquartile ranges; dots indicate data points. |

Llgl1 promotes timely deposition of laminin to the apical ventricular surface. (A-D‴) Confocal z-slices of the ventricle of Tg(myl7:LifeAct-GFP) transgenic embryos visualising the myocardium (green) and anti-laminin antibody (magenta) in wild-type siblings (A,C) and llgl1 mutant embryos (B,D). Yellow boxed areas are enlarged to the right. A-D and A″-D″ show a merge view, A′-D′ and A‴-D‴ show laminin staining. llgl1 mutants still exhibit basal laminin at 72 hpf (B), and are yet to clearly establish apical laminin at 80 hpf (D). Scale bar=25 µm. (E) Quantification of apicobasal laminin intensity in the outer curvature shows that laminin is basally enriched in both wild-type siblings and llgl1 mutants at 55 hpf (wild-type, n=27; llgl1 mutants, n=26). Laminin is apically enriched in wild-type siblings from 72 hpf onwards (72 hpf, n=48; 80 hpf, n=49), whereas llgl1 mutants exhibit no apical laminin enrichment at 72 hpf (n=40), and only apical enrichment at 80 hpf (n=68). (F) Quantification of apicobasal laminin intensity in the ventricular apex reveals that both wild-type siblings and llgl1 mutants have enrichment of basal laminin at 55 hpf (wild type, n=25; llgl1 mutants, n=23). Wild-type siblings do not exhibit significant degradation of basal laminin and enrichment of apical laminin until 80 hpf (72 hpf, n=45; 80 hpf, n=42), whereas llgl1 mutants still retain significant levels of basal laminin at 72 hpf (n=40), and do not have significant apical deposition even by 80 hpf. (E,F) Kruskal–Wallis test with multiple comparisons (n=58) (****P<0.0001, ***P<0.001, **P<0.01, *P<0.05). ns, non significant. Box plots show median values (middle bars) and first to third interquartile ranges (boxes); whiskers indicate 1.5× the interquartile ranges; dots indicate data points. (G) Schematic depicting dynamics of laminin distribution in wild type and llgl1 mutants. |

The epicardium deposits laminin onto the apical ventricular surface. (A-F) Sections through the hearts of two-colour mRNA in situ hybridisation analysis of lamb1a (A,B), lamc1 (C,D) and myl7 controls (E,F) in blue, combined with myl7 expression (red) to highlight the myocardium, at 62 hpf and 72 hpf (n=3 per gene/stage). lamb1a and lamc1 are expressed in epicardial cells adjacent to/on the surface of the myocardium (arrowheads), contrasting with the myl7 blue/red control demonstrating colocalised myocardial stains. Scale bars: 200 μm. A-F show coronal sections. (G-N) mRNA in situ hybridisation analysis of lamb1a and lamc1 expression in control MO and wt1a MO-injected embryos at 72 hpf. G,I,K,M show ventral views, H,J,L,N show lateral views. Scale bars: 25 µm. Control MO-injected embryos express lamb1a and lamc1 around the ventricle (red arrow, lamc1 n=6, lamb1a n=5), whereas wt1a MO-injected embryos lose expression of both lamb1a and lamc1a around the ventricle (lamc1 n=9, lamb1a n=6) but retain low levels in the atrium (orange arrow). (O-R′) Confocal z-slices of the ventricle of 80 hpf Tg(myl7:HRAS-GFP) transgenic embryos injected with either control MO (O,P) or wt1a MO (Q,R), and an anti-Cav1a antibody (magenta; O,Q) or anti-laminin antibody (magenta; P,R). Scale bars: 25 µm. Control MO-injected embryos exhibit expression of Cav1a (n=9/10) and laminin (n=10/10) at the apical CM surface (O,P), whereas wt1a MO-injected embryos show loss of both Cav1a (Q, n=9/9) and laminin (R, n=10/10) expression. O-R show a merge view, O′-R′ show Cav1a or laminin staining. |

Llgl1 is required for timely epicardial emergence and ventricular colonisation. (A-F′) Confocal z-slices through the ventricle of Tg(myl7:LifeAct-GFP) transgenic embryos visualising the myocardium (green) and anti-Cav1a antibody (magenta), highlighting the epicardium at 76 hpf (A-D) and 96 hpf (E,F). Wild-type embryos show full epicardial coverage at 76 hpf (A, n=12/12), whereas only a small subset of llgl1 mutants have full epicardial coverage (C, n=3/15), or only a few epicardial cells attached (D′, blue arrow, n=3/15) and the majority have partial epicardial coverage (B′, yellow arrows, n=9/15). By 96 hpf Cav1a+ epicardium surrounds the ventricle in both wild type (E, n=4/4) and the majority of llgl1 mutant embryos (F, n=5/6). A′-F′ show Cav1a staining only. Scale bars: 25 µm. (G-J) mRNA in situ hybridisation analysis of wt1a expression in wild-type and llgl1 mutant embryos at 55 hpf. G and I show the ventral view, dashed line outlines the heart; H and J show the lateral view. Scale bars: 50 µm. Both wild-type and llgl1 mutant embryos express wt1a in proepicardial cells in the dorsal pericardium; however; whereas wild-type embryos have wt1a+ cells attached to the ventral ventricular wall (red arrow, H), these cells are reduced or absent in llgl1 mutants (red arrow, J). (K) Quantification of the number of epicardial cells attached to the ventral ventricular wall in wild type (n=28) and llgl1 mutants (n=21). Comparative analysis performed using unpaired two-tailed t-test (**P<0.01). Data are mean±s.d. (L) Schematic model of epicardium, laminin and Crb2a dynamics between 55 hpf and 84 hpf. |

Laminin promotes epicardial emergence and ventricular colonisation. (A-F) Confocal z-slices through the ventricle of Tg(myl7:LifeAct-GFP) transgenic embryos visualising the myocardium (green) and anti-Cav1a antibody (magenta), highlighting the epicardium at 76 hpf in wild-type siblings (A,D), lamb1a mutants (B,C) and lamc1 mutants (E,F). A′-F′ show Cav1a staining only. Scale bars: 25 µm. Wild-type embryos show full epicardial coverage at 76 hpf (A, n=12/12; D, n=11/11), whereas lamb1a and lamc1 mutants show defects in epicardial coverage. The majority of lamb1a mutants have partial epicardial coverage (B′, yellow arrow, n=10/13), with a small number exhibiting full epicardial coverage (C, n=3/13). lamc1 mutants have more profound epicardial defects, with the majority having no epicardial cells attached at 76 hpf (F, n=6/9), and a small proportion having only a few epicardial cells attached (E′, white arrow, n=3/9). (G-N) mRNA in situ hybridisation analysis of wt1a expression at 55 hpf in wild-type embryos (G,H,K,L), lamb1a mutants (I,J) and lamc1 mutants (M,N). G,I,K,M show the ventral view, dashed line outlines the heart; H,J,L,N show the lateral view. Scale bars: 50 µm. Similar to wild-type siblings (H, n=10; J, n=12), both laminin mutants have wt1a expression in proepicardial cells on the dorsal pericardium (L, n=11; N, n=12; orange arrows). Wild-type embryos also have epicardial cells attached to the ventral ventricular wall (H,L; red arrows) but both lamb1a and lamc1 mutants show little attachment of epicardial cells to the ventral ventricle at 55 hpf (J,N). |

Cell-autonomous analysis of Llgl1 requirements in epicardial colonisation and cardiomyocyte extrusion. (A-D) Live light-sheet z-slices through the ventricle of Tg(myl7:LifeAct-GFP) transgenic embryos with rhodamine-dextran-labelled donor myocardial cells (magenta) at 76 hpf. Scale bars: 15 μm. (E) Quantification of host extruding cells and transplanted extruding cells in the four embryos with extruding transplanted CMs. (F-J) Live light-sheet z-slices through the ventricle of Tg(myl7:LifeAct-GFP) transgenic embryos with rhodamine-dextran-labelled donor epicardial cells (magenta) at 76 hpf. Scale bars: 15 μm. Transplanted epicardial cells can be flattened (white arrow, F,G,I) or rounded (yellow arrow, H,J). Epicardial cells can be seen surrounding an extruding CM (blue arrowhead, G). (K) Schematic depicting classification of epicardial cells and outer curvature. (L) Quantification of transplanted flattened mature epicardial cell number. Each dot represents a single embryo. (M) Quantification of number of epicardial cells on outer curvature. Each dot represents a single embryo. Data in L and M are mean±s.d. (N) Categorisation of total epicardial cells as flattened (mature) or rounded (immature). Flattened mature epicardial cells are significantly associated with wild-type donors (Fisher's exact test: P=0.0002). (O) Proportion of epicardial cells associated with the outer curvature. Wild-type transplanted epicardial cells are significantly more likely to be positioned on the outer curvature (Fisher's exact test: P=0.0252). |