
|
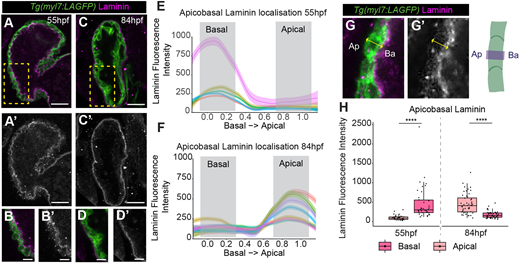
Fig. 3 Laminin deposition shifts from basal to apical ventricular surface. (A-D′) Confocal z-slices of the ventricle of Tg(myl7:LifeAct-GFP) transgenic embryos visualising the myocardium (green) and anti-laminin antibody (magenta). A-D show a merge view, A′-D′ show laminin staining. Laminin is deposited on the luminal basal myocardial surface at 55 hpf (A,A′), but is enriched on the apical exterior surface of the myocardium at 84 hpf (C-D′). Scale bars: 25 µm. B and D show a magnification of the yellow boxed areas in A and C, respectively. Scale bars: 10 µm. (E,F) Example quantifications of laminin intensity across the standardised apicobasal axis of individual CMs at 55 hpf (E) and 84 hpf (F). Grey boxes indicate apicobasal positions used to bin data into apical/basal domains. (G,G′) Example images and schematic showing method for quantifying laminin across the apicobasal CM axis. Ap, apical; Ba, basal. (H) Quantification of laminin fluorescence intensity at apical and basal positions in ventricular CMs at 55 hpf and 84 hpf. Each point represents an individual cell (55 hpf, n=38; 84 hpf, n=48). One-way ANOVA with multiple comparisons (****P<0.0001). Box plots show median values (middle bars) and first to third interquartile ranges (boxes); whiskers indicate 1.5× the interquartile ranges; dots indicate data points.