
- Title
-
Cytokines IL-1β and IL-10 are required for Müller glia proliferation following light damage in the adult zebrafish retina
- Authors
- Lu, C., Hyde, D.R.
- Source
- Full text @ Front Cell Dev Biol
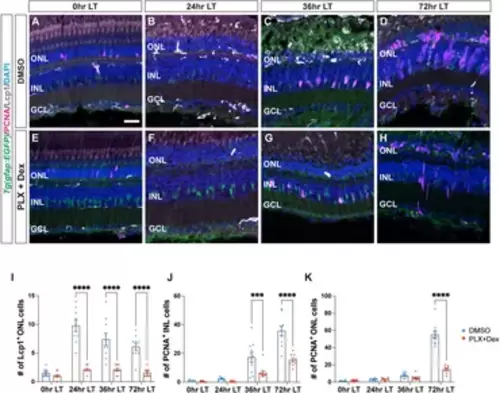
Treatment with PLX3397 and Dexamethasone reduces the number of microglia and proliferating Müller glia in light-damaged retinas. (A–H) Confocal images of albino;Tg(gfap:EGFP)nt11 retinas that were light-damaged and collected at 0, 24, 36, and 72 h of light treatment (LT). Eyes were intravitreally injected with either DMSO (A–D) or PLX3397 and Dexamethasone (PLX + Dex, E-H) at 0 h LT. Sections were immunostained to detect GFP (Müller glia, green), PCNA (proliferating cells, magenta), and Lcp1 (microglia, white), with DAPI counterstain (nuclei, blue). (I) Quantifications of the numbers of Lcp1+ ONL cells under the different conditions described above. (J,K) The numbers of PCNA+ cells were quantified in the INL (J) and ONL (K). Quantifications were normalized to 300 μm along the length of the central-dorsal retina. Statistical analyses were performed using two-way ANOVA with Bonferroni’s post hoc test. Graphs represent the Mean ± SEM and n ≥ 9. ***, p < 0.001, ****, p < 0.0001. ONL, outer nuclear layer; INL, inner nuclear layer; GCL, ganglion cell layer. Scale bar in A is 20 µm and is the same for (B–H). |

Cytokine genes are dynamically expressed following light damage. (A) qRT-PCR analysis of three cytokine genes, which are commonly associated with inflammatory effects: il-1β (red line, yellow dot), il-6 (red line, green dot), and ifng1 (red line, red dot) and three cytokine genes, which are usually associated with inhibiting inflammation: il-10 (blue line, blue dot), il-13 (blue line, yellow dot), il-4 (blue line, green dot), across light treatment (LT) time course (0, 6, 12, 24, 36, and 72 h LT) and 1-day (120 h) and 7-days (264 h) recovery (after completing 96 h constant LT). All values are normalized to 18 s rRNA reference gene. The mRNA expression levels are displayed as log2-fold change relative to 0 h LT from three independent replicates with a pool of 6-7 dorsal retinas for each replicate. (B) qRT-PCR analysis of il-1β expression at 0 h and 24 h LT in Standard Control morphants (S.C. MO, blue circles) and tnfa morphants (red circles). Data was normalized to 18 s rRNA reference gene and displayed as log2-fold change relative to the S.C. MO control group. For the qRT-PCR, three independent replicates were performed with a pool of 6-7 dorsal retinas for each replicate. (C,D) Previously published single-cell RNA-Seq data (Hoang et al., 2020) were analyzed by violin plots for il-1β expression in microglia (C) and Müller glia (D). The time points included in the snRNA-Seq dataset correspond to 0, 4, 10, 20, and 36 h LT. (E–J‴) Confocal images of dark-adapted albino;Tg(gfap:EGFP)nt11 zebrafish retinas that were isolated at 0 (E–E’’’), 6 (F–F’’’), 12 (G–G’’’), 24 (H–H’’’), 36 (I–I’’’), and 72 h LT (J–J’’’). Retinal sections were labeled by in situ hybridization with a probe for il-1β magenta: (E–J,E’’–J’’’), grayscale: (E’–J’). Sections were also immunostained to detect GFP Müller glia, green: (E–J,E’’-J’’’) and Lcp1 microglia, grayscale: (E–J, E’’–J’’’), with DAPI counterstain nuclei, blue: (E–J, E′′–J‴). Orange boxes in (E–J) were magnified to better portray il-1β signal in microglia (E’’–J’’) and yellow boxes in E-J were magnified to better portray il-1β signal in Müller glia (E’’’–J’’’). The magnified images in (E’’–J’’’) represent single z-plane images. ONL, outer nuclear layer; INL, inner nuclear layer; GCL, ganglion cell layer. Scale bar in E is 20 µm and is the same for F-J’ and scale bars in E’’ and E’’’ are 5 µm and are the same for (F’’–J’’) and (F’’’–J’’’), respectively. Graphs represent the Mean ± SEM and n = 3. *, p < 0.05, ****, p < 0.0001. |

Cytokine IL-1β is necessary for Müller glia proliferation in light-damaged retinas. (A–D) Confocal images from albino;Tg(gfap:EGFP)nt11 retinas that were intravitreally injected with a caspase-1 inhibitor Ac-YVAD-cmk (YVAD) 24 h prior to the start of light treatment and continued to inject every 24 h until 36 h LT. At 0 h LT, retinas were intravitreally injected with either DMSO vehicle control: (A,C) or YVAD (B,D). Retinal sections were immunostained to detect GFP Müller glia, green: (A,B) ande PCNA proliferating cells, magenta in (A,B), grayscale in (C,D), with DAPI counterstain (nuclei, blue: (A,B). (E) The numbers of PCNA+ INL cells in the YVAD group (red circles) relative to the DMSO control group (blue circles). (F–I) Confocal images of retinas from albino;Tg(gfap:EGFP)nt11 zebrafish electroporated with either Standard Control (S.C.; (F,H) or il-1β morpholino (MO; (G,I) to knockdown IL-1β protein expression and immediately placed in constant light treatment. Retinas were collected at 36 h LT and immunostained to detect GFP Müller glia, green: (F,G) and PCNA proliferating cells, magenta in (F,G), grayscale in (H,I), with DAPI counterstain (nuclei, blue: (F,G). (J) Quantification of the numbers of PNCA+ INL cells in the il-1β morphant (red circles) and the S.C. MO (blue circles). Quantifications were normalized to 300 μm along the length of the central-dorsal retina. Statistical analyses were performed using Student’s t-test. Graphs represent the Mean ± SEM and n ≥ 7. ****, p < 0.0001. ONL, outer nuclear layer; INL, inner nuclear layer; GCL, ganglion cell layer. Scale bars in (A,F) are 20 μm and are the same for (B–D) and (G–I), respectively. |

Recombinant IL-1β is sufficient to induce Müller glia proliferation in undamaged retinas. (A–F) Confocal images of albino;Tg(gfap:EGFP)nt11 retinas that were electroporated with Standard Control (S.C.; (A–C) and il-1β morpholinos (D–F) prior to the start of constant light treatment and intravitreally injected with either MO only (A,D), PBS (B,E) or recombinant IL-1β protein (C,F), and placed in LT. Retinal sections were collected at 36 h LT and immunostained to detect GFP (Müller glia, green) and PCNA (proliferating cells, magenta), with DAPI counterstain (nuclei, blue). (G) Quantification of the numbers of PCNA+ INL cells in il-1β morphants alone and injected with PBS (vehicle, blue circles) relative to S.C. morphants (red circles). Müller glia proliferation was rescued in il-1β morphants injected with IL-1β protein. (H–K) Confocal images of retinas from albino;Tg(gfap:EGFP)nt11 zebrafish that were injected with either PBS (H,I) or recombinant IL-1β protein (J,K) in undamaged retinas every 24 h. Retinal sections were collected at 2- and 3-days following the first injection (dpi) and immunolabeled for GFP (Müller glia, green) and PCNA (proliferating cells, magenta), with DAPI counterstain (nuclei, blue). (L,M) Quantifications showing the numbers of PCNA+ cells in the INL (L) and ONL (M) under different conditions described above. (N,O) Quantifications of the numbers of Lcp1+ cells in the INL (N) and ONL (O) under different conditions. (P) qRT-PCR analysis of pro-inflammatory (red circles) and anti-inflammatory (blue circles) cytokine gene expression profiles in undamaged retinas injected with IL-1β protein and collected at 3dpi. Data was normalized to 18 s rRNA reference gene and displayed as log2-fold change relative to the PBS (vehicle) control group. For the qRT-PCR, three independent replicates were performed with a pool of 6-7 dorsal retinas for each replicate. Cell count quantifications (G,L–O) were normalized to 300 μm along the length of the central-dorsal retina. Statistical analyses were performed using either a two-way ANOVA (G,L–O) or one-way ANOVA (P) both followed by Bonferroni’s post hoc test. Graphs represent the Mean ± SEM and n ≥ 10, *, p < 0.05, **, p < 0.01; ***, p < 0.001; ****, p < 0.0001; ns, no significance. ONL, outer nuclear layer; INL, inner nuclear layer; GCL, ganglion cell layer. Scale bar in A and H is 20 μm and is the same for (B–F) and (I–K), respectively. |

Cytokine IL-10 is necessary, but not sufficient, for Müller glia proliferation. (A–F) Confocal images of retinas from albino;Tg(gfap:EGFP)nt11 zebrafish that were electroporated with Standard Control (S.C.; (A–C) or il-10 morpholinos (D–F) prior to the start of constant light treatment and intravitreally injected with either MO only (A,D), PBS (B,E) or recombinant IL-10 protein (C,F), and placed in LT. Retinal sections were collected at 36 h LT and immunolabeled for GFP (Müller glia, green) and PCNA (proliferating cells, magenta), with DAPI counterstain (nuclei, blue). (G) Quantifications of the numbers of PCNA+ INL cells under different conditions. Müller glia proliferation was rescued in il-10 morphants injected with IL-10 protein. (H–K) Confocal images of albino;Tg(gfap:EGFP)nt11 retinas that were injected with either PBS (H,I) or recombinant IL-10 protein (J,K) in undamaged retinas every 24 h. Retinal sections were collected at 2- and 3-days following the first injection (dpi) and immunolabeled to detect GFP (Müller glia, green) and PCNA (proliferating cells, magenta), with DAPI counterstain (nuclei, blue). Red boxes in I and K were magnified to better portray the EGFP signal in the hypertrophied Müller glia (I’,K’). Arrow and arrowhead mark a hypertrophied cell body and process, respectively. (L–O) Quantifications of the numbers of PCNA+ cells (L, M) and Lcp1+ cells (N,O) in the INL (L,N) and ONL (M,O). (P) qRT-PCR analysis of gliotic-associated gene expression in undamaged retinas injected with IL-10 protein and collected at 3dpi. Data was normalized to 18 s rRNA reference gene and displayed as log2-fold change relative to the PBS (vehicle) control group. For the qRT-PCR, three independent replicates were performed with a pool of 6-7 dorsal retinas for each replicate. Cell count quantifications (G,L–O) were normalized to 300 μm along the length of the central-dorsal retina. Statistical analyses were performed using either a two-way ANOVA (G,L–O) or one-way ANOVA (P) both followed by Bonferroni’s post hoc test. Graphs represent the Mean ± SEM and n ≥ 8. *, p < 0.05, **, p < 0.01; ***, p < 0.001; ns, no significance. ONL, outer nuclear layer; INL, inner nuclear layer; GCL, ganglion cell layer. Scale bars in (A,H) are 20 μm and are the same for (B–F) and (I–K), respectively. Scale bar in (I′) is 10 μm and is the same for (K’). |

Cytokine IL-1β induction of Müller glia proliferation does not require IL-10. (A–D) Confocal images of undamaged albino;Tg(gfap:EGFP)nt11 zebrafish retinas that were intravitreally injected with IL-1β alone (A), or electroporated with il-10 morpholino and intravitreally injected with either MO only (B), PBS (C), or IL-1β protein (D). Sections were collected at 3 days post-injection (dpi) and immunostained for GFP (Müller glia, green) and PCNA (proliferating cells, magenta), with DAPI counterstain (nuclei, blue). (E) Quantifications of the numbers of PCNA+ INL cells under different conditions. (F) Quantifications of the numbers of PCNA+ ONL cells under different conditions. Quantifications were normalized to 300 μm along the central-dorsal retina. Statistical analyses were performed using one-way ANOVA followed by Tukey’s post hoc test. Mean ± SEM and n ≥ 9, **, p < 0.01; ****, p < 0.0001; ns, not significant. ONL, outer nuclear layer, INL, inner nuclear layer, GCL, ganglion cell layer. Scale bar in A is 20 μm and is the same for (B–D). |

Model of pro-inflammatory cytokine IL-1β and anti-inflammatory cytokine IL-10 inducing Müller glia proliferation in light-damaged retinas. (A) Schematic depicting rod and cone photoreceptors (blue and brown, respectively), Müller glia (purple), and resting microglia (gray) in an undamaged retina. (B) Upon light damage, the resting microglia move from the locations in the plexiform layers to the outer retina where they become activated and begin phagocytosing dying rods and cones. The dying photoreceptors express TNFα. (C) The activated microglia express IL-1β and IL-10 in a dynamic fashion that signal the Müller glia to reprogram. (D) The reprogrammed Müller glia divide asymmetrically to produce a neuronal progenitor cell (NPC, green), which will continue to proliferate and differentiate into the missing retinal neurons. |