
|
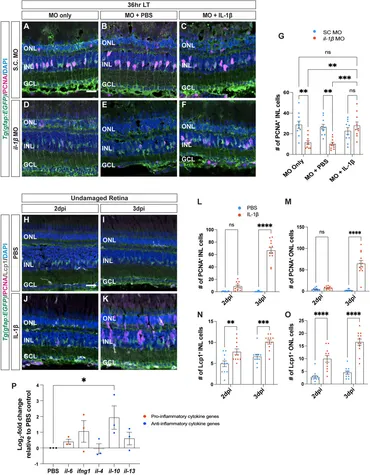
Fig. 4 Recombinant IL-1β is sufficient to induce Müller glia proliferation in undamaged retinas. (A–F) Confocal images of albino;Tg(gfap:EGFP)nt11 retinas that were electroporated with Standard Control (S.C.; (A–C) and il-1β morpholinos (D–F) prior to the start of constant light treatment and intravitreally injected with either MO only (A,D), PBS (B,E) or recombinant IL-1β protein (C,F), and placed in LT. Retinal sections were collected at 36 h LT and immunostained to detect GFP (Müller glia, green) and PCNA (proliferating cells, magenta), with DAPI counterstain (nuclei, blue). (G) Quantification of the numbers of PCNA+ INL cells in il-1β morphants alone and injected with PBS (vehicle, blue circles) relative to S.C. morphants (red circles). Müller glia proliferation was rescued in il-1β morphants injected with IL-1β protein. (H–K) Confocal images of retinas from albino;Tg(gfap:EGFP)nt11 zebrafish that were injected with either PBS (H,I) or recombinant IL-1β protein (J,K) in undamaged retinas every 24 h. Retinal sections were collected at 2- and 3-days following the first injection (dpi) and immunolabeled for GFP (Müller glia, green) and PCNA (proliferating cells, magenta), with DAPI counterstain (nuclei, blue). (L,M) Quantifications showing the numbers of PCNA+ cells in the INL (L) and ONL (M) under different conditions described above. (N,O) Quantifications of the numbers of Lcp1+ cells in the INL (N) and ONL (O) under different conditions. (P) qRT-PCR analysis of pro-inflammatory (red circles) and anti-inflammatory (blue circles) cytokine gene expression profiles in undamaged retinas injected with IL-1β protein and collected at 3dpi. Data was normalized to 18 s rRNA reference gene and displayed as log2-fold change relative to the PBS (vehicle) control group. For the qRT-PCR, three independent replicates were performed with a pool of 6-7 dorsal retinas for each replicate. Cell count quantifications (G,L–O) were normalized to 300 μm along the length of the central-dorsal retina. Statistical analyses were performed using either a two-way ANOVA (G,L–O) or one-way ANOVA (P) both followed by Bonferroni’s post hoc test. Graphs represent the Mean ± SEM and n ≥ 10, *, p < 0.05, **, p < 0.01; ***, p < 0.001; ****, p < 0.0001; ns, no significance. ONL, outer nuclear layer; INL, inner nuclear layer; GCL, ganglion cell layer. Scale bar in A and H is 20 μm and is the same for (B–F) and (I–K), respectively.