
- Title
-
Effects of Inducible Nitric Oxide Synthase (iNOS) Gene Knockout on the Diversity, Composition, and Function of Gut Microbiota in Adult Zebrafish
- Authors
- Huang, Y., Chen, Y., Xie, H., Feng, Y., Chen, S., Bao, B.
- Source
- Full text @ Biology (Basel)

Characterization of zebrafish genotypes and intestinal analyses. (A) Results of zebrafish gene knockout verification. (B) Amino acid coding results of nos2a and nos2b gene knockout in zebrafish (C) Images of zebrafish with different genotypes. (D) Measurement of nitric oxide (NO) levels in the intestines of different genotypes, **** p < 0.0001. (E) Histological sections of intestinal tissues from zebrafish with various genotypes (5 months old adult zebrafish). |

Diversity and principal component analysis of microbial communities. (A) Shannon index calculated using the Kruskal–Wallis H test; larger Shannon values indicate higher community diversity. (B) Simpson index calculated using the Kruskal–Wallis H test; the greater the value of Simpson’s index, the lower the diversity of the community. (C) Richness and evenness of species within the samples: Species richness is indicated by the width of the curve along the horizontal axis—the wider the curve (greater horizontal spread), the more diverse the species composition. The evenness of the species composition is reflected by the shape of the curve—the flatter the curve (smaller vertical spread), the higher the evenness. (D) Principal Component Analysis (PCA): By decomposing variances, PCA displays the differences among multiple datasets on a coordinate plot. Axes represent the principal components with the largest variance. The closer the clustering of points within the same group, the better the stability within that group. The greater the distance between different groups, the larger the differences between them. |

Analysis of gut microbiota composition at different taxonomic levels. Changes in the microbial community at the phylum level between wild-type and iNOS knockout zebrafish. Bar charts represent the mean ± SEM, n = 3 per group * p < 0.05. (A) Phylum-level analysis of different samples. (B) Composition of gut microbiota at the genus level in different samples. (C) Differences in microbial communities at the genus level among different samples, analyzed using the Kruskal–Wallis algorithm. (D) Heatmap analysis of the total microbial biomass. |
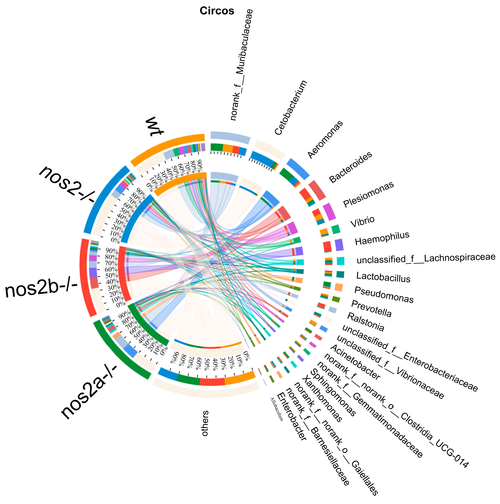
The Circos plot illustrates the relationship between microbial abundance and host genotypes. The outermost ring of the plot depicts segments corresponding to various bacterial genera, with their names duly annotated. Inner bands connect these segments to a range of host genotypes, including wild-type (wt) and inducible nitric oxide synthase (iNOS) knockout, indicating the proportion of each bacterial genus present in each genotype. Adjacent to the names of the bacteria, colored bars represent the relative abundance within the respective genotypes. The breadth and color intensity of the bands are indicative of the level of association, signifying the variation in bacterial distribution across different genotypes. |

Transcriptomic Sequencing of nos2−/− mutant and wild-type (WT) groups. Heatmap of differentially expressed genes associated with key metabolic and immune pathways. Expression levels are depicted as log2 fold change between knockout and wild-type groups. (A) Distribution of shared and unique genes between the nos2−/− mutant and the wild-type group (WT). (B) Number of differentially expressed genes between the nos2−/− mutant and the wild-type group (WT). (C) Gene ontology (GO) enrichment analysis, *** p <0.001. (D) Enrichment of pathways in the Kyoto Encyclopedia of Genes and Genomes (KEGG). All statistical analyses were conducted using R software version 3.6.1. Differences were considered significant at p < 0.05. |

RT-qPCR validation of changes in mRNA expression levels of immune genes normalized to mRNA expression levels in wild-type (WT). (A) Significant differences in gene expression between the nos2−/− mutant group and the wild-type (WT) group. (B) The horizontal axis is the gene name, the vertical axis is the microorganism; the asterisk indicates that the p-value is less than 0.05, which is represented by *; the color indicates the correlation, red indicates the positive correlation, and blue indicates the positive correlation. (C) mRNA expression levels of upregulated genes. (D) mRNA expression levels of downregulated genes.** Data represent three independent experiments. Note: Asterisks (*) denote statistical significance; ‘ns’ indicates no statistical significance; * p < 0.05, ** p < 0.01, *** p < 0.001, **** p < 0.0001. |