FIGURE SUMMARY
Title

Gliovascular transcriptional perturbations in Alzheimer's disease reveal molecular mechanisms of blood brain barrier dysfunction

Authors
İş, Ö., Wang, X., Reddy, J.S., Min, Y., Yilmaz, E., Bhattarai, P., Patel, T., Bergman, J., Quicksall, Z., Heckman, M.G., Tutor-New, F.Q., Can Demirdogen, B., White, L., Koga, S., Krause, V., Inoue, Y., Kanekiyo, T., Cosacak, M.I., Nelson, N., Lee, A.J., Vardarajan, B., Mayeux, R., Kouri, N., Deniz, K., Carnwath, T., Oatman, S.R., Lewis-Tuffin, L.J., Nguyen, T., Alzheimer’s Disease Neuroimaging Initiative, Carrasquillo, M.M., Graff-Radford, J., Petersen, R.C., Jr Jack, C.R., Kantarci, K., Murray, M.E., Nho, K., Saykin, A.J., Dickson, D.W., Kizil, C., Allen, M., Ertekin-Taner, N.
Source
Full text @ Nat. Commun.

Summary of the snRNAseq approach utilized in this study.

a Post-mortem temporal cortex tissue from 24 individuals that comprise sex and age matched AD and control individuals were used in this study. b Development and optimization of nuclei isolation protocol for snRNAseq platform. c Well-established cell type markers were used to annotate nuclei clusters and d major brain cell types were visualized in UMAP plots. Figure 1/panels a and b Created with BioRender.com released under a Creative Commons Attribution-NonCommercial-NoDerivs license.

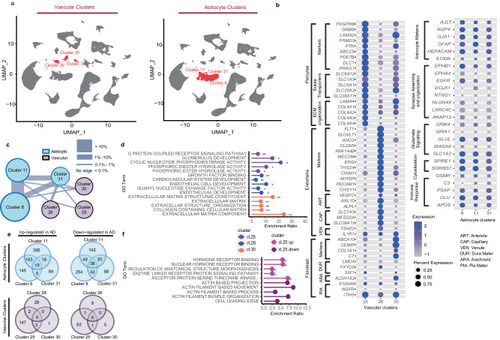
Vascular and astrocytic snRNAseq analyses reveal unique vascular clusters of which pericytes are the most perturbed in AD brains.

a Three vascular and three astrocytic clusters were demonstrated in UMAP plots. b We identified three distinct vascular clusters which could be classified as pericytes (cl.25), endothelia (cl.26) and perivascular fibroblasts (cl.30), owing to the unique expression profiles of their highly expressed signature genes. Unlike the vascular clusters, the astrocytic clusters were less distinct from each other. c The constellation plot displays the relatedness of the 3 vascular and 3 astrocyte (see Fig. 3) clusters, based on post-hoc classification of cells. The thickness of the connecting line between any two clusters was determined by the percent of cells that are ambiguously assigned. Astrocyte clusters demonstrated greater relatedness as shown by the thick connecting lines (~1-10%). Vascular clusters, on the other hand, demonstrated more distinct cell populations with thin connecting lines (~0-1%). d Top Enriched GO terms of signature genes in each vascular cluster show distinct functions. *: enrichment FDR < 0.05. **: enrichment FDR < 0.001. e We also identified DEGs in these vascular clusters; the largest numbers of which were in the pericyte cl.25 (1562 up, 64 down), followed by endothelial cl.26 (34 up, 10 down) and perivascular fibroblasts cl.30 (8 up, 6 down). Pericyte cluster showed the highest number of DEGs in AD further implicating these cells. f Top GO Term Enrichment analysis was summarized for pericyte cluster cl.25, which shows pathways involved in cell-to-cell communication are upregulated. The full name of the fifth GO term from the top is, “NEGATIVE REGULATION OF TRANSMEMBRANE RECEPTOR PROTEIN SERINE THREONINE KINASE SIGNALING”. Source data are provided as a Source Data file. Figure 2/panels c and e Created with BioRender.com released under a Creative Commons Attribution-NonCommercial-NoDerivs license.

Discovery, prioritization, validation, and replication of perturbed GVU vascular target-astrocyte ligand pair SMAD3-VEGFA.

a Strength and direction of NicheNet vascular target-astrocyte ligand interactions. Left: predicted ligands in astrocyte clusters. Right: predicted targets in vascular clusters. Edge: regulation strength between ligands and target genes; Cyan astrocyte, purple: endothelial markers. Direction of change in AD is denoted as blue for up and red for downregulation. b Of the perturbed vascular targets in AD brains, SMAD3, which is upregulated in AD pericytes and has strong astrocytic connections, is prioritized. Of the astrocytic ligands, VEGFA, which is downregulated in AD and has strong predicted interactions with SMAD3, is prioritized. c, d We validated expression of SMAD3 in vascular cells and VEGFA expression in astrocyte cells through RNAscope (scale bar:100 µm) and immunofixation (scale bar:10 µm). e Immunohistochemistry results showed significantly higher phospho-SMAD3 immunoreactivity in AD compared to controls in pericytes (p < 0.01, n = 10 per diagnosis). fSMAD3 and VEGFA brain expression changes in external brain snRNAseq studies. Pericytes (purple) and astrocytes (cyan) were from multiple studies and were clustered (Gray dots: other nuclei). In forest plots, the square indicates the coefficient, which is the natural log(fold change). The left bar: 2.5% confidence interval; the right bar: 97.5% confidence interval. (Ast: astrocytes, Per: pericytes, TCX: temporal cortex, MTX: midtemporal cortex, EC: entorhinal cortex, DLPFC: dorsolateral prefrontal cortex, PFC: prefrontal cortex, SFX: superior frontal cortex, Hippocampus: HC, AG: angular gyrus, TH: thalamus) g 6 intronic variants associated with higher blood expression levels of SMAD3 (eQTL) were also associated with decreased brain infarcts in ADNI, MCSA, and meta-analyzed cohorts. P-values and direction of effects from the infarct GWAS and the eQTL analysis in MCSA, ADNI, and meta-analysis (random effects) are shown. h, i Whole-brain association analysis of blood SMAD3 levels with brain Aβ deposition and cortical thickness in the ADNI cohort. Color scales indicate regions where higher blood SMAD3 were associated with less brain amyloid-β deposition and less brain atrophy, respectively. Statistical maps were thresholded for a multiple testing adjustment to a corrected significance level of 0.05. Source data are provided as a Source Data file.

VEGF regulates of SMAD3 expression levels in pericytes.

a We differentiated 2 AD and 2 control patient-derived iPSCs to pericytes as previously described79, treated the differentiated pericytes with recombinant VEGF, VEGFR2 (KDR) inhibitor cocktail, and aggregated Aβ and analyzed the impact on SMAD3 expression at three time points (6, 12, and 24 h). bd Validation of pericyte differentiation was performed via flow cytometry, immunocytochemistry, and RT-qPCR. We observed decreased expression of iPSC pluripotency marker, TRA-10, and increased expression of pericytic PDGFRB and NG2 through FACS in the differentiated pericytes. We also visualized and confirmed pericytic PDGFRB expression through ICC (scale bar:100 µm) and observed upregulation of pericyte and vascular markers after differentiation. Statistics: two-sided paired t-test, n = 4 biologically independent samples; within each experiment, n = 6 technical replicates. e We observed significant decrease in SMAD3 expression after 24 h of VEGF treatment. f Consistently, VEGFR2 inhibitor cocktail treatment caused significant increase in SMAD3 expression at all time points. g Aggregated Aβ treatment did not cause significant change in SMAD3 expression (n = 5 per each duration). Statistics derived from biologically independent replications (different iPSC lines and differentiation batches). All boxplots represent the first quartile, the median, and the third quartile. The upper whisker indicates the maximum value no further than 1.5 times the inter-quartile range from the third quartile. The lower whisker indicates the minimum value no further than 1.5 times the inter-quartile range from the first quartile. Source data are provided as a Source Data file. Figure 4/panel a Created with BioRender.com released under a Creative Commons Attribution-NonCommercial-NoDerivs license.

SMAD3-VEGF interactions influence blood-brain-barrier integrity in a zebrafish amyloidosis model.

a We pharmacologically treated transgenic zebrafish model Tg(kdrl:GFP) with vegfr2 blockers to reduce VEGF signaling. b Double immunostaining for GFP and pSMAD3 coupled to DAPI nuclear counterstain. Lower panels indicate percentage of pSMAD3+ cells. In endothelia panel, insets indicate neuronal pSMAD3. Inside brackets the number of analyzed cells are shown. Vegfr2 blockage increased the percentage of pSMAD3+ endothelial cells and pericytes (GFP+/DAPI+). c pERK and GFP double immunostaining coupled to DAPI nuclear counterstain in control and vegfr2 blocker treated zebrafish models. Inside brackets the number of analyzed spots are shown. Vegfr2 blocking decreased pERK/GFP colocalization in zebrafish models. d Double immunostaining for ZO-1 and GFP in control and vegfr2 blocker-treated zebrafish models coupled to DAPI nuclear counterstain. Treatment caused decreased colocalization of ZO-1/GFP, indicating impaired integrity in zebrafish brain vasculature. Correlation graph between random measurements between pERK/GFP vs ZO-1/GFP indicated strong association. R indicates the correlation coefficient. Scale bars equal 5 µm (b) and 10 µm (c,d).e Colocalization coefficients of pERK/GFP and ZO-1/GFP are correlated. With decreased pERK, ZO-1 also reduces, similarly, high pERK expressing vascular cells also has high ZO-1 levels. GFP always marks the vasculature, and therefore is common to both separate correlations. Source data are provided as a Source Data file. Figure 5/panel a Created with BioRender.com released under a Creative Commons Attribution-NonCommercial-NoDerivs license.

Acknowledgments
This image is the copyrighted work of the attributed author or publisher, and ZFIN has permission only to display this image to its users. Additional permissions should be obtained from the applicable author or publisher of the image. Full text @ Nat. Commun.