FIGURE SUMMARY
Title

Rbpms2 promotes female fate upstream of the nutrient sensing Gator2 complex component Mios

Authors
Wilson, M.L., Romano, S.N., Khatri, N., Aharon, D., Liu, Y., Kaufman, O.H., Draper, B.W., Marlow, F.L.
Source
Full text @ Nat. Commun.

Rbpms2 binds and regulates RNAs required for testis development and ribosome and ribonucleoprotein biogenesis.

a RNAIP and Negative control constructs and RNAIP scheme. b UMAP of cell populations in 40 dpf ovary20 and representative UMAPs of rboRNAs in given cell population(s) of the 40 dpf ovary. Number of RNAs in a category are given in the header and rboRNAs associated with testis fates are specified in the header as well. c Top 10 GO biological processes associated with rboRNAs. Dark blue indicates not significant and increasing lighter shades of blue indicate increasing significant values. d Volcano plot of differential gene expression in 21 dpf bipotential wildtype and rbpms2 DM gonads from bulk RNA sequencing. rboRNAs are overlayed in blue and all RNAs are labeled in gray. (c-d) Differential Gene Enrichment was calculated with the DESeq2 package adjusted P = 0.05, adjusted P (−log10) = 1.30 and fold change of 2.00, log2 fold change (−1.00|1.00). e Representative gene set enrichment plots for GO Ribosome Biogenesis, GO Nucleolar Part, and GO Regulation of TOR Signaling from bulk RNA sequencing of 21 dpf wildtype versus rbpms2 DM gonads. Dark red indicates more frequently detected in rbpms2 DM gonads, pink indicates slightly more expressed in rbpms2 DM gonads, light blue indicates slightly more expressed in wildtype gonads, and dark blue indicates more frequently expressed in wildtype gonads. NES, nominal p-value, and FDR were calculated via the Gene Set Enrichment Analysis algorithm. Source data are provided as a Source Data file.

Nucleolar and ribosome biogenesis factors are dysregulated in rbpms2 DMs.

a Schematic of nucleolar development from mitosis to prophase I arrest. Briefly, upon entry into meiosis, the singular nucleolus of the germ cell disassembles. As the cell progresses through prophase I, new nucleoli are amplified through seeding by rDNA loci and nucleoli begin to expand. Nucleolar expansion, maturation, and ribosome biogenesis continues up until meiotic arrest at diplotene. b, c Transmission electron micrographs of 35 dpf wildtype and rbpms2 DM oocytes. Dashed lines outline oocyte cytoplasmic membrane and black arrowheads indicate nucleoli. Scale bar is 5 µM. d Quantification of number of nucleoli per oocyte in wildtype (n = 2 fish) and rbpms2 DM (n = 2 fish) gonads. A minimum of 20 prophase I cells per genotype were analyzed and categorized into the following groups: 1 nucleolus (blue), 2–4 nucleoli (purple), and 4+ nucleoli (green). Source data are provided as a Source Data file. e, f p-Ubtf (active RNA pol I; purple) and RNA pol II (yellow) immunostaining in 31-35 dpf wildtype (rbpms2aae30; rbpms2bsa9329 heterozygous mutant; n = 4) and rbpms2 DM (rbpms2aae30; rbpms2bsa9329 double homozygous mutant; n = 4) germ cells. Enlarged views of boxed regions show representative localization of p-Ubtf in wildtype and rbpms2 DM oocytes and white arrows indicate p-Ubtf localization in nucleoli. Scale bar for all images is 20 µM. g, h Fibrillarin (yellow) immunostaining in 29-33 dpf wildtype (rbpms2aae30; rbpms2bsa9329 heterozygous mutant; n = 4) and rbpms2 DM (rbpms2aae30; rbpms2bsa9329 double homozygous mutant; n = 4) germ cells. Enlarged views of boxed regions show representative localization of Fibrillarin in wildtype and rbpms2 DM oocytes. Scale bar for all images is 20 µM. eh Germ cells are labeled by Ddx4 (teal) and nuclei are labeled with DAPI (white).

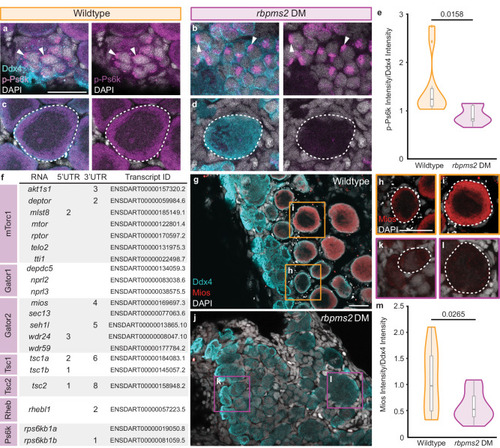
Rbpms2 functions upstream of the Gator2 complex protein, Mios.

ad Immunostaining of p-Ps6k (purple) in 29-33 dpf wildtype (rbpms2aae30; rbpms2bsa9329 heterozygous mutant; n = 4) and rbpms2 DM (rbpms2aae30; rbpms2bsa9329 double homozygous mutant; n = 4) germ cells. Germ cells are labeled with Ddx4 (teal) and nuclei are labeled with DAPI (white). a, b Arrows indicate p-Ps6k localization in mitotic and early meiotic nuclei. c, d Dashed lines indicate early oocytes. Adjacent panel shows p-Ps6k and DAPI localization in indicated cells. Scale bar is 20 µM. e Quantification of the p-Ps6k intensity normalized to the intensity of Ddx4 for wildtype (rbpms2aae30; rbpms2bsa9329 heterozygous mutant; n = 10 cells from 3 individual fish) and rbpms2 DM (rbpms2aae30; rbpms2bsa9329 homozygous mutant; n = 9 cells from 3 individual fish) oocytes. Two-tailed paired equal variance Student’s t tests were performed for the indicated groups. P = 0.05. f Table of mTorc1-related components with predicted Rbpms binding sites22 in their 3′ and/or 5′ UTRs. Transcript IDs evaluated for each component are listed and purple boxes indicate the protein component or complex of the pathway a given factor belongs to. gl Immunostaining for Mios (red) in 29-31 dpf wildtype (rbpms2aae30; rbpms2bsa9329 heterozygous mutant, n = 4) and rbpms2 DM (rbpms2aae30; rbpms2bsa9329 double homozygous mutant; n = 4) germ cells. Germ cells are labeled with Ddx4 (teal) and nuclei are labeled with DAPI (white). hl Dashed outline indicates oocytes and shows Mios and DAPI localization in indicated cells. Scale bar is 20 µM. m Quantification of the intensity of Mios normalized to the intensity of Ddx4 for wildtype (rbpms2aae30; rbpms2bsa9329 heterozygous mutant; n = 11 cells from 3 individual fish) and rbpms2 DM (rbpms2aae30; rbpms2bsa9329 double homozygous mutant; n = 11 cells from 3 individual fish) oocytes. Two-tailed paired equal variance student’s t tests were performed for the indicated groups. P = 0.05. e, m For box and whisker plots, line indicates median, boxes indicate upper (75th) and lower quartiles (25th), whiskers indicate data within 1.5 times the inner quartile range, and error bars represent minimum and maximum values. Any data outside of this range are plotted as individual points. Source data are provided as a Source Data file.

Mios is required for oogenesis and nucleolar maturation.

a Schematic of the Mios protein and mutagenized regions (black arrowheads) in the Miosms20 and Miossa proteins. Truncated proteins are shown below with highlighted DNA mutations and corresponding genotyping assays. The * in Miossa indicates the induced stop codon. bd Germ cell (Ddx4, teal) and DNA (DAPI, white) in miosms20/ms20 (50 dpf; n = 5), miossa/sa (45-51 dpf; n = 4), and miosms20/sa (50 dpf; n = 4) fish. Developing sperm are outlined with dashed lines and scale bar is 50 µM. e Sex ratio graph for 60 dpf+ wildtype, heterozygous, and mutant fish. Pink represents female fish and blue indicates male fish. Number of fish screened are indicated for each group. Statistical significance was evaluated by performing a two-tailed χ2 test with Bonferroni correction against the +/+ control group. P = 0.0125. f, g Fibrillarin (yellow) immunostaining in 35 dpf wildtype (n = 7) and mios-/- (n = 10) germ cells. Enlarged views of boxed regions show representative localization of Fibrillarin in wildtype and mios-/- oocytes. Scale bar for all images is 20 µM. h Quantification of the Fibrillarin puncta area normalized to oocyte nuclear area for wildtype (n = 9 cells from 3 individual fish) and mios-/- (n = 9 cells from 3 individual fish) oocytes. For box and whisker plots, line indicates median, boxes indicate upper (75th) and lower quartiles (25th), whiskers indicate data within 1.5 times the inner quartile range, and error bars represent minimum and maximum values. Any data outside of this range are plotted as individual points. Two-tailed paired equal variance Student’s t tests were performed for the indicated groups. P = 0.05. i, j p-Ubtf (active RNA pol I; purple) and RNA pol II (yellow) immunostaining in 35 dpf wildtype (n = 4) and mios-/- (n = 4) germ cells. Enlarged views of boxed regions show representative localization of p-Ubtf (red) and RNA pol II (white) in wildtype and mios-/- oocytes. Scale bar for all images is 20 µM. f, g, i, j Germ cells are labeled by Ddx4 (teal) and nuclei are labeled with DAPI (white). Source data are provided as a Source Data file.

Mios promotes oogenesis through mTorc1 signaling.

ad Immunostaining of p-Ps6k (purple) in 35 dpf wildtype (n = 7) and mios-/- (n = 10) germ cells. Germ cells are labeled with Ddx4 (teal) and nuclei are labeled with DAPI (white). a, b Arrows indicate p-Ps6k localization in mitotic and early meiotic nuclei. c, d Dashed lines indicate early oocytes. Adjacent panel shows p-Ps6k and DAPI localization in indicated cells. Scale bars are 20 µM. e Quantification of the intensity of p-Ps6k normalized to the intensity of Ddx4 for wildtype (n = 21 cells from 7 individual fish) and mios-/- (n = 25 cells from 8 individual fish). Two-tailed paired equal variance Student’s t tests were performed for the indicated groups. P = 0.05. fmTORca transgene: the human mTORca expression is driven by the germline ziwi promoter and the heart specific promoter cmlc2 drives mCherry expression as a selectable marker. Scheme depicts injection into 1-cell embryos and generation of stable Tg[ziwi:mTORca] lines. g Sex ratios for 90 dpf+ fish with ms49 and ms64 mTORca alleles. Pink represents female and blue represents males; numbers of fish screened are indicated for each group. Non-transgenic siblings are indicated by - and transgenic siblings are indicated with + and the specific mTORca alleles are indicated. Statistical significance was evaluated by performing a two-tailed χ2 test with Bonferroni correction against the mios +/+; +/- non-transgenic control group. P = 0.0125. h Fertility assays and quantifications of total eggs, degenerating eggs, and fertility rates for ms49 and ms64 Tg[ziwi:mTORca] fish (n = 3 fish per genotype and transgenic condition). Non-transgenic siblings are indicated by - and transgenic siblings are indicated with + and the specific mTORca alleles are indicated. Two-tailed paired equal variance Student’s t tests were performed for the indicated groups. P = 0.05. All other comparisons were non-significant. e, h For box and whisker plots, line indicates median, boxes indicate upper (75th) and lower quartiles (25th), whiskers indicate data within 1.5 times the inner quartile range, and error bars represent minimum and maximum values. Any data outside of this range are plotted as individual points. Source data are provided as a Source Data file.

DSB inhibition does not restore oogenesis in mios-/-.

a Sex ratio graph for 60 dpf+ mios; spo11uc73 double heterozygous, heterozygous mutant, mutant wildtype, mutant heterozygous, and double mutant fish. Pink represents female fish and blue indicates male fish. Number of fish screened are indicated for each group. Statistical significance was evaluated by performing a two-tailed χ2 test with Bonferroni correction against the mios+/-; spo11+/uv73 control group. P = 0.0125. Source data are provided as a Source Data file. b Germ cell (Ddx4, teal) and DNA (DAPI, white) in mios-/- (mios;spo11 mutant wildtype/mutant heterozygous fish, n = 6) and (c) mios-/-; spo11uc73/uc73 double mutant fish (n = 7). Developing oocytes (b) and sperm (c) are outlined with dashed lines, respectively. Scale bar is 50 µM.

mTorc1 activation in oogenesis uniquely requires Mios.

a Sex ratio graph for 60 dpf+ mios; tsc2vu242 double heterozygous, mutant wildtype, and mutant heterozygous fish. Pink represents female fish and blue indicates male fish. Number of fish screened are indicated for each group. Statistical significance was evaluated by performing a two-tailed χ2 test with Bonferroni correction against the mios+/-; tsc2+vu242 control group. P = 0.0125. bRhebca transgene: the rat Rhebca expression is driven by the germline ziwi promoter and the heart specific promoter cmlc2 drives mCherry expression as a selectable marker. Sex ratios are presented for 60 dpf+ fish with the ms44, ms46, and ms47 Rhebca alleles. Pink represents female and blue represents males; number of fish screened are indicated for each group. Statistical significance was evaluated by performing the two-tailed χ2 test with Bonferroni correction against the +/- transgenic control group. P = 0.0125. Source data are provided as a Source Data file. c In mitotic and early meiotic cells, Rbpms2 functions to repress translation of rboRNAs related to testis fates and promotes translation of rboRNAs related to mechanisms supporting oogenesis like ribosomal factors. Correspondingly, Rbpms2 functions upstream of nucleoli amplification and nucleolar localization of RNA pol I, which is required for rRNA transcription. In addition, Rbpms2 promotes translation of Mios. After sufficient nucleolar amplification, Gator2 and Mios activity increase mTorc1 signaling, and the nucleoli of differentiating oocytes expand and mature to support high levels of rRNA synthesis. As nucleoli grow, they develop an additional compartment that supports pre-ribosome biogenesis. Finally, as the cell progresses to diplotene, ribosomal abundance is measured. If sufficient ribosomes are present the cells continue through oogenesis. If a sufficient ribosome pool is not attained, then the gonocytes abort oogenesis and switch to spermatogenesis. We anticipate this pathway operates in oocytes independent of sex determination systems utilized as Mios is required for oocyte maturation in invertebrate and vertebrate organisms that use sex chromosome based or multigenic sex determination mechanisms.

Acknowledgments
This image is the copyrighted work of the attributed author or publisher, and ZFIN has permission only to display this image to its users. Additional permissions should be obtained from the applicable author or publisher of the image. Full text @ Nat. Commun.