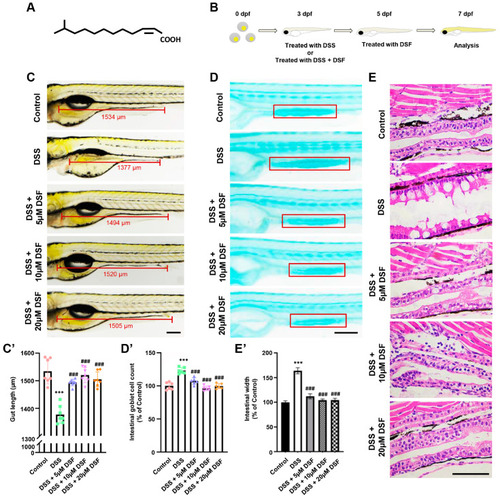
DSF ameliorated DSS-induced intestinal damage in zebrafish larvae. (A) The chemical structure of DSF. (B) Schematic diagram of the zebrafish experimental design. (C,C’) Representative images and the data of gut length from different groups. (D,D’) Detection and counting of goblet cells in zebrafish (red box) using Alcian blue staining method. (E,E’) Representative images and the data of histopathological examination of zebrafish intestine using H&E staining. Data are shown as mean ± S.D. *** p < 0.001 vs. control group; ### p < 0.001 vs. DSS group. Scale bar, 100 μm.

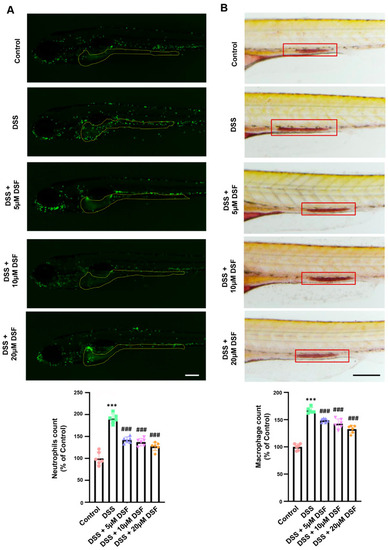
DSF inhibited the aggregation of neutrophils and macrophages in the inflammatory sites of zebrafish induced by DSS. (A) Live imaging of Tg(mpx:eGFP) larva and quantitative analysis of neutrophils in the yellow dotted line areas. (B) Neutral red staining showed macrophage accumulation (red boxes) and the quantitative analysis of macrophages in the red box areas. Data are shown as mean ± S.D. *** p < 0.001 vs. control group; ### p < 0.001 vs. DSS group. Scale bar, 100 μm.

DSF regulates the expression of inflammatory factors and tight junction markers. (A) The relative mRNA expression levels of pro-inflammatory cytokines (tnfα, il6, il1b, il10) and inflammatory pathway factors (cox2, nfkb1, tab1, fadd) were measured with qRT-PCR. (B) The relative mRNA expression levels of tight junction markers (claudin1, occludin1). Data are shown as mean ± S.D. * p < 0.05, ** p < 0.01, *** p < 0.001 vs. control group; ##p < 0.01, ### p < 0.001 vs. DSS group.

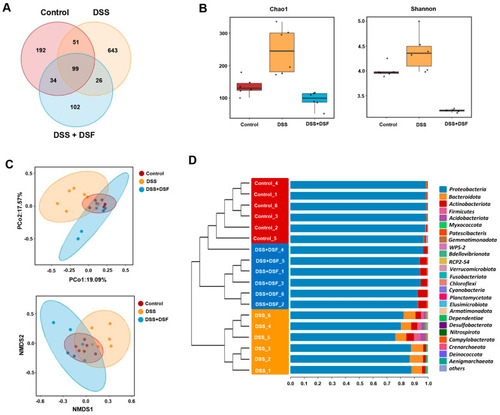
DSF regulates the diversity of gut microbiota in zebrafish colitis induced by DSS. (A) Venn diagram indicating the species richness determined by ASVs in each group. (B) Evaluation of α-diversity, as determined by abundance index (Chao1) and diversity index (Shannon). (C) Evaluation of β-diversity, as determined by PCoA and NMDS analysis. (D) The UPGMA clustering tree analysis. n = 6 for each group.

Effects of DSF on species composition. Relative abundance plots displaying the differences in the microbial community structure at the phylum level (A,B) and genus level (C,D). (E) Genera of bacteria with significant changes related to inflammation. n = 6 for each group.

Microbial taxa discrepancies under the effect of DSF. LEfSe analysis of cladogram (A) and histogram (B). (C) Heatmap analysis at the genus level. n = 6 for each group.

DSF suppressed the infection of A. hydrophila or S. aureus in zebrafish. Growth curves of A. hydrophila (A) and S. aureus (B) under 20 µM DSF treatment. Fluorescence images (C,D) and quantitative analysis of intestinal fluorescence intensity (C’,D’) of A. hydrophila or S. aureus in zebrafish intestine. Histopathological examination of zebrafish intestine infected with A. hydrophila (E,E’) or S. aureus (F,F’). Data are shown as mean ± S.D. * p < 0.05, ** p < 0.01 vs. control group; ##p < 0.01 vs. A. hydrophila group or S. aureus group. Scale bar, 100 μm.

DSF restrained intestinal damage caused by the infection of A. hydrophila or S. aureus in zebrafish. (A) Imaging of Alcian blue staining and counting of goblet cells in the intestine of zebrafish (red box). (B) Live imaging of Tg(mpx:eGFP) zebrafish larva infected with A. hydrophila or S. aureus and quantitative analysis of neutrophils. (C) Imaging of macrophage accumulation (red boxes) and the quantitative analysis of macrophages in the intestine of zebrafish (red box). Data are shown as mean ± S.D. *** p < 0.001 vs. control group; ### p < 0.001 vs. A. hydrophila group or S. aureus group. Scale bar, 100 μm.

Schematic diagram of the molecular mechanism of DSF improving DSS-induced zebrafish colitis.

Acknowledgments
This image is the copyrighted work of the attributed author or publisher, and ZFIN has permission only to display this image to its users. Additional permissions should be obtained from the applicable author or publisher of the image. Full text @ Nutrients