
- Title
-
Targeting autophagy impairment improves the phenotype of a novel CLN8 zebrafish model
- Authors
- Marchese, M., Bernardi, S., Ogi, A., Licitra, R., Silvi, G., Mero, S., Galatolo, D., Gammaldi, N., Doccini, S., Ratto, G.M., Rapposelli, S., Neuhauss, S.C.F., Zang, J., Rocchiccioli, S., Michelucci, E., Ceccherini, E., Santorelli, F.M.
- Source
- Full text @ Neurobiol. Dis.
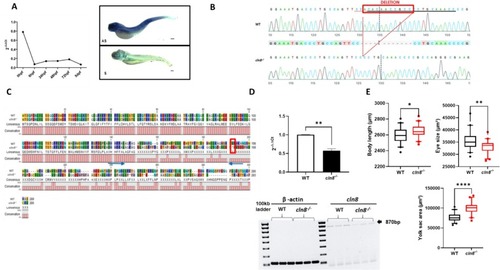
Generation of cln8−/− mutants. (A) Temporal and spatial expression of cln8 mRNA during zebrafish development evaluated using qRT-PCR and in situ hybridization at 5 dpf, the upper image indicates the antisense probe (AS), the figure below is the sense probe (S). (B) Sequence alignment of WT and mutant cln8−/− embryos shows the generation of cln8−/− mutant zebrafish by deletion of 11 bp of the cln8 gene. (C) Protein alignment of WT and mutant cln8−/−. The red rectangle shows the premature stop codon at residue 191 (p.Ala151Glufs*191), while the blue arrows indicate the forward and reverse primers used for qRT-PCR. (D) qRT-PCR analysis revealed a decrease in cln8 mRNA expression, normalized to β-actin. The image represents the RT-PCR of of the entire cln8 coding sequence, showing the decreased expression in mutants. Three independent RNA samples (each obtained from about 30–40 larvae) from cln8−/− larvae at 120 hpf and from controls were analyzed. The values are expressed as mean ± standard deviation (SD). **p ≤ 0.05, calculated by Student's t-test. (E) Morphology analysis of 5 dpf cln8−/− and WT embryos shows a slight increase in body length, a decreased eye size and an increased yolk sac area in the mutant larvae (n = 40). Data are represented as box and whisker plot with 5–95% confidence interval. All data were obtained from three independent experiments and were analyzed through statistical analysis (***p ≤ 0.001; *p ≤ 0.05) performed using the Mann-Whitney test. |
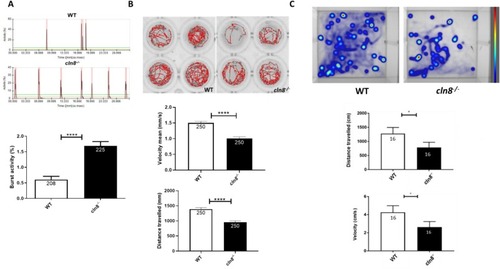
Characterization of locomotor behavior of cln8−/− mutants. (A) Analysis of coiling behavior (tail flicks) in 30 hpf WT and cln8−/− mutant embryos. (B) Locomotion analysis of 5 dpf WT and cln8−/− larvae. (C) Locomotor behavior of adult WT and cln8−/− zebrafish. All data were obtained from three independent experiments and were analyzed through statistical analysis (***p ≤ 0.001; *p ≤ 0.05) performed using the Mann-Whitney test. The values are expressed as mean ± standard error of the mean (SEM) |

Evaluation of the pathological signs of NCL in cln8−/− mutants. (A) Immunofluorescence analysis of subunit c of mitochondrial ATP synthase (SCMAS) in 5 dpf WT and cln8−/−embryos. (B) Acridine orange staining in brains of mutant and control 24 hpf embryos. (C) Lysotracker in vivo staining in 5 dpf WT and cln8−/− larvae. (D) Bodipy staining in live 5 dpf mutant and control larvae. Three independent experiments were performed in each group: cln8−/− and controls. Statistical analysis was performed using the Mann-Whitney test (****p ≤ 0.0001; ***p ≤ 0.001; *p ≤ 0.05). (scale bar = 100 μm). The number inside the bars is the sample size. The values are expressed as mean ± standard error of the mean (SEM). |

Electroencephalographic recordings and brain calcium imaging in cln8−/− mutants. (A) The images on the left show the local field potential (LFP) traces of 5 dpf WT and cln8−/− larvae with (below) the power spectrum calculated in the 30–95 Hz passband lasting 16 min. On the right, the representative z-projection images of the brain calcium imaging performed in the larvae in 16 min of recording (see calcium fluorescence heatmap). (B) LFP analysis using MATLAB software. The graphs represent the duration and power of identified events in 15 WT and 15 cln8−/− fish. (C) Analysis of calcium imaging was performed by calculating Pearson's coefficient of skewness in the two groups. Statistical analysis was performed using the Mann-Whitney test (****p ≤ 0.0001; ***p ≤ 0.001; **p ≤ 0.01; *p ≤ 0.05). Violin plots show the median and quartiles. |

Evaluation of inflammatory response in cln8−/− mutant larvae. qRT-PCR analysis of inflammatory factors. Three independent experiments were performed for each experimental group (cln8−/−− and WT controls). Statistical analysis (*p ≤ 0.05) was performed using the t-test. The values are expressed as mean ± standard error of the mean (SEM). |

Analysis of autophagy pathway in cln8−/− mutants. (A) The graphs show the qRT-PCR analysis of autophagy factors, performed by normalizing to β-actin, and comparing cln8−/− larvae with controls at 5 dpf. Three independent samples (each obtained from about 30–40 larvae) from controls and cln8−/− mutant larvae at 120 hpf were analyzed. Statistical analysis (* p ≤ 0.05, **p ≤ 0.01, *** p ≤ 0.001) was performed using Student's t-test. The values are expressed as mean ± standard deviation (SD). (B) Three independent larval homogenates from controls (n = 50) and cln8−/− larvae (n = 50) were tested by Western blotting for the expression of LC3, Rab7, Ctsd, and ATG5 protein. The levels of the proteins were normalized to ß-actin or GAPDH. Statistical analysis (*p ≤ 0.05, **p ≤ 0.01) was performed using Student's t-test. The values are expressed as mean ± standard error of the mean (SEM). |

Consequences of the effective molecules, SG2 and trehalose. (A) Analysis of the effects of the SG2 and trehalose on locomotion (distance traveled and velocity) in cln8−/−. (B) Analysis of the effects of the two compounds on coiling behavior of cln8−/− embryos. The values are expressed as mean ± standard error of the mean (SEM). (C) Analysis of the effects of trehalose and SG2 on the duration and power of LFP events. (D) Analysis of calcium imaging analysis performed by calculating Pearson's coefficient in WT and treated and untreated cln8−/−. The experiments were performed in triplicate. The graphs represent the median and SEM. Statistical analysis (**** p ≤ 0.0001; ***p ≤ 0.001; **p ≤ 0.01; *p ≤ 0.05) was performed using the Mann-Whitney test. Violin plots show the median and quartiles. |
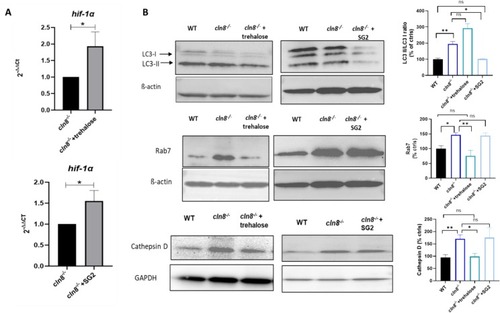
Analysis of autophagy pathway after trehalose and SG2 administration. qRT-PCR analysis of hypoxia-inducible factor 1-alpha (hif-1α). qRT-PCR analysis was performed (normalizing to β-actin) in untreated cln8−/− larvae compared with cln8−/− larvae treated with trehalose and SG2 at 5 dpf. Three independent RNA samples (each obtained from about 30–40 larvae) from controls and cln8−/− mutant larvae at 5 dpf 120 hpf were analyzed. *p ≤ 0.05, **p ≤ 0.01, ***p ≤ 0.001, calculated by Student's t-test. The values are expressed as mean ± standard error of the mean (SEM). (B) Three independent larval homogenates from WT (n = 50), untreated cln8−/− (n = 50) and treated cln8−/−larvae were tested by Western blotting for the expression of LC3, Rab7 and cathepsin D protein. The levels of the protein were normalized to β-actin. * p ≤ 0.05, **p ≤ 0.01, calculated by one-way ANOVA test. The values are expressed as mean ± SEM. |