
Image
|
Figure Caption
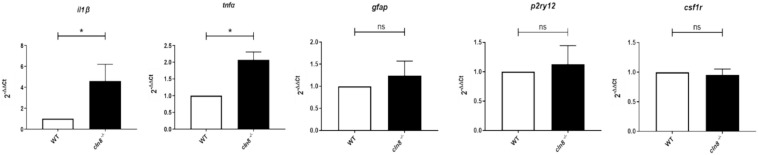
Fig. 5 Evaluation of inflammatory response in cln8−/− mutant larvae. qRT-PCR analysis of inflammatory factors. Three independent experiments were performed for each experimental group (cln8−/−− and WT controls). Statistical analysis (*p ≤ 0.05) was performed using the t-test. The values are expressed as mean ± standard error of the mean (SEM).
Acknowledgments
This image is the copyrighted work of the attributed author or publisher, and
ZFIN has permission only to display this image to its users.
Additional permissions should be obtained from the applicable author or publisher of the image.
Full text @ Neurobiol. Dis.