
- Title
-
Angpt1 binding to Tie1 regulates the signaling required for lymphatic vessel development in zebrafish
- Authors
- Morooka, N., Gui, N., Ando, K., Sako, K., Fukumoto, M., Hasegawa, U., Hußmann, M., Schulte-Merker, S., Mochizuki, N., Nakajima, H.
- Source
- Full text @ Development
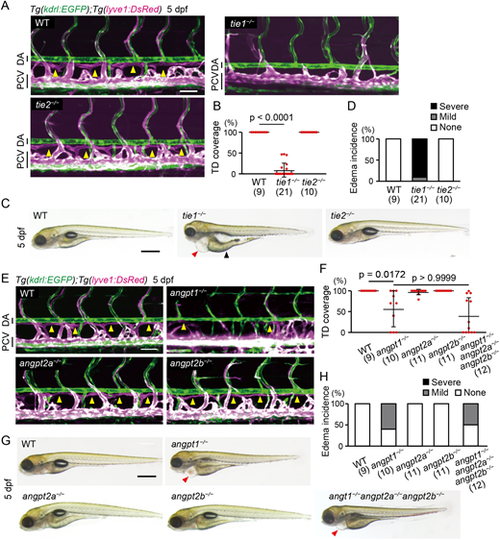
Angpt1 and Tie1 are essential for trunk lymphangiogenesis in zebrafish. (A) Representative confocal images of the trunk of Tg(kdrl:EGFP);Tg(lyve1:DsRed) WT, tie1−/− and tie2−/− larvae (5 dpf). These Tg larvae express EGFP (green) in all endothelial cells (ECs) and DsRed (magenta) in venous and lymphatic ECs. Formation of the thoracic duct (TD; yellow arrowheads in WT and tie2−/− larvae) was impaired in tie1−/− larvae. Lateral views, anterior to the left. (B) Percentage of TD coverage at 5 dpf. Data are mean±s.d. (WT, n=9 larvae; tie1−/−, n=21 larvae; tie2−/−, n=10 larvae). (C) Overall morphology of WT, tie1−/− and tie2−/− larvae (5 dpf). Red and black arrowheads point to edema around the heart and intestine, respectively. (D) Percentage of edema incidence at 5 dpf. Data are mean±s.d. (WT, n=9 larvae; tie1−/−, n=21 larvae; tie2−/−, n=10 larvae). Typical pictures of each category are shown in Fig. S2G. (E) Trunk of Tg(kdrl:EGFP);Tg(lyve1:DsRed) WT, angpt1−/−, angpt2a−/− and angpt2b−/− larvae (5 dpf). Formation of the TD (yellow arrowheads in WT, angpt2a−/− and angpt2b−/− larvae) was impaired in the angpt1−/− larvae. (F) Percentage of TD coverage at 5 dpf. Data are mean±s.d. (WT, n=9 larvae; angpt1−/−, n=10 larvae; angpt2a−/−, n=11 larvae; angpt2b−/−, n=11 larvae; angpt1−/−angpt2a−/−angpt2b−/−, n=12 larvae). (G) Overall morphology of WT, angpt1−/−, angpt2a−/−, angpt2b−/− and angpt1−/−angpt2a−/−angpt2b−/− triple-mutant larvae (5 dpf). Arrowheads point to edema around the heart. (H) Percentage of edema incidence at 5 dpf, as in D. Data are mean±s.d. (WT, n=9 larvae; angpt1−/−, n=10 larvae; angpt2a−/−, n=11 larvae; angpt2b−/−, n=11 larvae; angpt1−/−angpt2a−/−angpt2b−/−, n=12 larvae). Scale bars: 50 μm (A,E); 500 µm (C,G). P-values were determined by Kruskal–Wallis test with Dunn's test (B,F). DA, dorsal aorta; PCV, posterior cardinal vein. |

Zebrafish Tie1 (zTie1) acts as the receptor for zAngpt1. (A) Schematic of the in vitro binding assay for B. The detailed procedure is described in the Materials and Methods section. Light blue circle, protein G sepharose beads. (B) In vitro binding of zebrafish Tie1 (zTie1)-Fc-His, zTie2-Fc-His or Fc-His to FLAG-Angpt1, FLAG-Angpt2a or FLAG-Angpt2b was examined. (C) 293T cells transfected with full-length zTie1 (zTie1-HA) and a kinase-deficient mutant of zTie1 (zTie1K854R-HA) were starved and stimulated with vehicle (−) and COMP-Ang1 (+) for 20 min. Cell lysates were subjected to immunoblot analyses with anti-phosphotyrosine (pTyr) and anti-HA antibodies for analyzing phosphorylated Tie1 and total Tie1, respectively, and also with anti-β-actin antibody. (D) Relative phosphorylation of zTie1 observed in C was quantified. Data are mean±s.d. from three independent experiments; each experiment includes duplicate determinations. P-values were determined by two-tailed Student's t-test. |

tie1 mutants exhibit defects in secondary sprouting from the posterior cardinal vein (PCV). (A) Trunk of Tg(kdrl:EGFP);Tg(lyve1:DsRed) WT and tie1−/− embryos (54 hpf). Formation of secondary sprouts (solid circles), PLs (arrowheads) and venous ISVs (V) were inhibited in tie1−/− embryos. (B) Percentage of PL coverage at 54 hpf. Data are mean±s.d. (WT, n=16 embryos; tie1+/−, n=38 embryos; tie1−/−, n=26 embryos). (C) Number of secondary sprouts scored across six segments at 54 hpf. Data are mean±s.d. (WT, n=16 embryos; tie1+/−, n=38 embryos; tie1−/−, n=26 embryos). (D) Number of vISVs scored across six segments at 54 hpf. Data are mean±s.d. (WT, n=16 embryos; tie1+/−, n=38 embryos; tie1−/−, n=26 embryos). (E) Percentage of WT and tie1−/− embryos with (+) and without (−) blood flow at 30, 36 and 48 hpf. The blood flow in tie1 mutants was gradually decreased during and after secondary sprouting (WT, n=9 embryos; tie1−/−, n=9 embryos). (F) Flow velocities in the PCV of Tg(kdrl:EGFP);Tg(lyve1:DsRed) WT/tie1+/− and tie1−/− embryos (45-46 hpf). Flow velocities were measured by tracking polyethylene glycol-coated fluorescent microspheres (PEG-coated FMs) injected intravascularly (see Movie 3). tie1−/− embryos showing normal flow velocities (360-485 µm/s) comparable to WT and tie1+/− siblings are indicated by blue dots and analyzed in G. Data are mean±s.d. (WT/tie1+/−, n=36 embryos; tie1−/−, n=52 embryos). (G) Number of secondary sprouts scored across six segments in WT/tie1+/− and tie1−/− embryos (45-46 hpf) at flow velocities between 360 µm/s and 485 µm/s, indicated as blue dots in F. Representative images and movie are shown in Fig. S6C and Movie 3, respectively. Data are mean±s.d. (WT/tie1+/−, n=15 embryos; tie1−/−, n=7 embryos). Scale bar: 50 μm. P-values were determined by one-way ANOVA with Tukey's test (B-D) and by two-tailed Student's t-test (G). PL, parachordal lymphangioblast. |

zTie1 regulates migration, proliferation and differentiation of sprouting ECs from the PCV. (A) Trunk of Tg(fli1:H2B-EGFP);Tg(lyve1:DsRed) WT and tie1−/− embryos (52 hpf). Orange, cyan and white dotted lines indicate horizontal myoseptums (HM), dorsal borders of the dorsal aorta (DA), and outlines of lyve1:DsRed-positive venous ECs, respectively. (B) Distance from the dorsal edge of the PCV to the dorsal edge of a secondary sprout (magenta dots) and to the tip cell nucleus (green dots) in WT and tie1−/− embryos at 52 hpf. Data are mean±s.d. (WT, n=18 sprouts in 4 embryos; tie1−/−, n=26 sprouts in 7 embryos). (C) Total distance traveled by the tip cell nucleus at each time point from the initiation of venous sprouting. Start time of sprouting (t=0) was 40.0±3.7 hpf in WT and 42.7±4.5 hpf in tie1 mutant. Data are mean±s.d. (WT, n=19 sprouts in 3 embryos; tie1−/−, n=19 sprouts in 4 embryos). *P<0.05; **P<0.01. (D) Mean velocity of the tip cell nucleus during the first 300 min of venous sprouting. Data are mean±s.d. (WT, n=19 sprouts in 3 embryos; tie1−/−, n=19 sprouts in 4 embryos). (E) Time-sequential images of the trunk of Tg(fli1:H2B-EGFP);Tg(lyve1:DsRed) WT and tie1−/− embryos from 36 hpf (when secondary sprouting starts in WT). White dotted lines outline lyve1:DsRed-positive ECs. (F) Number of cell divisions in a venous sprout from 36 to 56 hpf. Data are mean±s.d. (WT, n=15 sprouts in 4 embryos; tie1−/−, n=9 sprouts in 7 embryos). (G) Number of ECs from a venous sprout at 56 hpf. Data are mean±s.d. (WT, n=15 sprouts in 4 embryos; tie1−/−, n=9 sprouts in 7 embryos). (H) Whole-mount immunofluorescence staining for Prox1 (magenta) and GFP (green) in WT and tie1−/− Tg(kdrl:EGFP) embryos at 39 hpf. Arrowheads indicate Prox1-positive ECs. (I) Number of Prox1-positive ECs in the PCV across six segments at 39 hpf. Data are mean±s.d. (WT, n=9 embryos; tie1−/−, n=9 embryos). (J) During the process of lymphangiogenesis, ECs (green ovals) budding from the PCV migrate, proliferate, and undergo lymphatic differentiation. In contrast, all of these cell behaviors are inhibited in tie1 mutants. Scale bar: 50 μm. P-values were determined by two-tailed Student's t-test. |
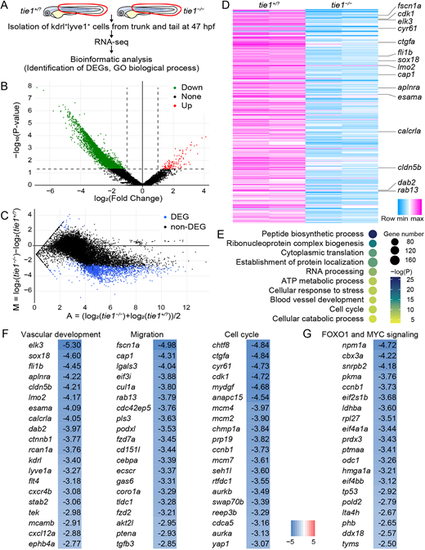
Tie1 signaling regulates gene expression involved in lymphatic development. (A) Schematic of the workflow. RNA-seq was performed in tie1−/− embryos and their WT and tie1+/− siblings (tie1+/?) (n=2 RNA samples each). (B) Volcano plot of the tie1−/− and tie1+/? gene set. The red, green and black dots represent upregulated (in tie1−/− embryos), downregulated and non-significant genes, respectively, with fold change >1 and P<0.05. (C) MA plot of 1942 DEGs (blue dots) with q-value <0.1 in the tie1−/− and tie1+/? gene set. (D) Heatmap of the most significant DEGs using log2(TPM+1) values. (E) Representative GO biological processes of the DEGs. (F) Heatmap of the DEGs associated with the GO terms ‘Vascular development’, ‘Migration’ and ‘Cell cycle’. Genes are ranked by log2 fold change tie1−/−/tie1+/?. (G) Heatmap of the DEGs associated with the FOXO1 and MYC signaling. Genes are ranked by log2 fold change tie1−/−/tie1+/?. |

Tie1 inhibits nuclear import of Foxo1a during secondary sprouting. (A) Trunk and tail of Tg(fli1:EGFP-foxo1a);Tg(fli1:H2B-mCherry) WT and tie1−/− embryos (31 hpf). (B) Trunk of Tg(fli1:EGFP-foxo1a);Tg(fli1:H2B-mCherry) WT (35 hpf) and tie1−/− embryos (43 hpf). The boxed areas are enlarged beneath. White dotted lines outline ECs sprouting from the PCV. Blue and yellow arrowheads indicate EGFP-Foxo1a in the cytoplasm and nucleus, respectively. (C) Quantitative analysis of the data shown in B. The graph shows the percentage of secondary sprouting ECs with nuclear EGFP-Foxo1a among total sprouting ECs from the PCV and CVP. Each dot represents an individual embryo. Data are mean±s.d. (WT/tie1+/−, n=4 embryos; tie1−/−, n=3 embryos). Six to ten sprouting ECs were measured in each embryo. (D) Time-sequential images of the trunk of a Tg(fli1:EGFP-foxo1a);Tg(fli1:H2B-mCherry) WT embryo from 35 hpf. Elapsed time (h:min). White dotted lines outline an EC sprouting from the PCV. Before nuclear migration, EGFP-Foxo1a was exported from the nuclei (yellow arrowheads) to the cytoplasm (blue arrowheads). (E) Time-sequential images of the trunk of a Tg(fli1:EGFP-foxo1a);Tg(fli1:H2B-mCherry) embryo (from 33 hpf) treated with 30 µM LY294002 just after the z-stack imaging at 0:00. Elapsed time (h:min). The boxed areas are enlarged beneath. Treatment with LY294002 altered the localization of EGFP-Foxo1a in a secondary sprouting EC from cytoplasmic (blue arrowheads) to nuclear (yellow arrowheads), leading to retraction of the sprouts. (F) Percentage of ECs in which EGFP-Foxo1a localization was unchanged or changed between cytoplasm (C) and nucleus (N) in secondary sprouting ECs after DMSO or LY294002 treatment. Tg(fli1:EGFP-foxo1a);Tg(fli1:H2B-mCherry) embryos were treated with DMSO or 30 µM LY294002 at 34 hpf during time-lapse imaging and localization changes examined before treatment (34 hpf) and 2 h after treatment (36 hpf) (DMSO, n=15 secondary sprouts; LY294002, n=19 secondary sprouts). (G) Fluorescence intensity of nuclear EGFP-Foxo1a in individual secondary sprouting ECs was quantified before treatment (34 hpf) and 2 h after treatment with DMSO or 30 µM LY294002 (36 hpf). The fluorescence intensity at 2 h after treatment was expressed relative to that before treatment. Scale bars: 50 μm (A); 30 µm (B,D,E). P-values were determined by two-tailed Student's t-test. CVP, caudal vein plexus. |
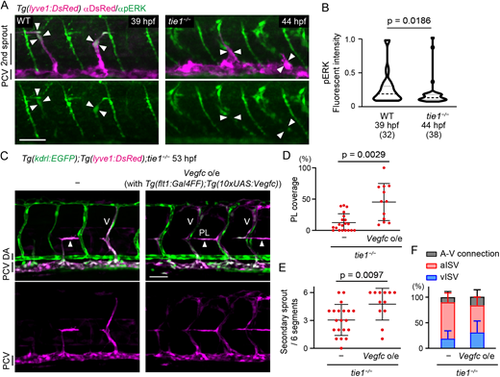
Tie1 regulates lymphatic development at least in part through the modulation of Vegfc/Vegfr3 signaling. (A) Whole-mount immunofluorescence staining for pERK (green) and DsRed (magenta) in WT and tie1−/− Tg(lyve1:DsRed) embryos. Arrowheads point to EC nuclei of secondary sprouts assessed by the DAPI staining. Secondary sprouts migrate towards the HM around 39 hpf in WT and 44 hpf in the tie1 mutant. (B) Quantitative analyses of the data shown in A. Fluorescence intensity of nuclear pERK staining (DAPI+ area, not shown in A) was quantified in the lyve1:DsRed+ ECs budding from the PCV of WT (39 hpf) and tie1−/− (44 hpf) embryos. Data are mean±s.d. (WT, n=32 ECs in 5 embryos; tie1−/−, n=38 ECs in 7 embryos). (C) Trunk of Tg(kdrl:EGFP);Tg(lyve1:DsRed) tie1−/− embryos with or without Tg(flt1:Gal4FF);Tg(10×UAS:vegfc) (53 hpf). Formation of PLs (arrowheads) and venous ISVs (V) are partially recovered by overexpression (o/e) of Vegfc in the tie1 mutant. (D) Percentage of PL coverage at 54 hpf. Data are mean±s.d. (tie1−/−, n=20 embryos; tie1−/− with Vegfc o/e, n=12 embryos). (E) Number of secondary sprouts scored across six segments at 54 hpf. Data are mean±s.d. (tie1−/−, n=20 embryos; tie1−/− with Vegfc o/e, n=12 embryos). (F) Number of A-V connections across six segments at 54 hpf. Data are mean±s.d. (tie1−/−, n=20 embryos; tie1−/− with Vegfc o/e, n=12 embryos). Scale bars: 50 μm. P-values were determined by two-tailed Mann–Whitney test (B) and by two-tailed Student's t-test (D,E). |