
- Title
-
Vitamin B12 uptake across the mycobacterial outer membrane is influenced by membrane permeability in Mycobacterium marinum
- Authors
- Izquierdo Lafuente, B., Verboom, T., Coenraads, S., Ummels, R., Bitter, W., Speer, A.
- Source
- Full text @ Microbiol Spectr

B12 synthesis and metabolism in mycobacteria. (A) B12 synthesis and metabolism in M. marinum; the cobC gene (in red) was mutated (cobC::fs) to disrupt B12 synthesis in M. marinum MUSA. (B) Reporter assay employing a B12-sensitive pinib4-mCherry construct in a cobC mutant strain. This assay detects incomplete synthesis pathways, producing a fluorescent signal. Bacteria were exposed to varying B12 concentrations, leading to signal reduction with increased B12 levels. M. marinum WT (wild-type) strain and WT expressing the reporter construct were used as controls. (C) The enzymes MetH and MetE convert L-homocysteine into L-methionine. MetH relies on B12 as a cofactor, while MetE operates independently of B12. Translation of metE is regulated by an RNA riboswitch. |

B12 is scavenged in M. marinum. (A) The cobC-metE::fs mutant is B12-auxotrophic. Bacteria were inoculated at optical density (OD600) 0.05 and grown with 1 µg/mL B12. After bacterial cultures reached the logarithmic phase (OD600 ~ 1), bacteria were diluted to OD600 0.05 and grown in media without B12. The cobC::fs strain served as control. (B) Growth curves of WT, cobC::fs, and cobC-metH::fs strains. Bacteria were started at OD600 0.05 and grown with and without 1 µg/mL B12 (C) Growth assays in WT, cobC::fs, and cobC-metH::fs in 7H10 with and without B12. Bacteria in the logarithmic phase were spotted in 10-fold serial dilutions and incubated for a week until visible growth. |

B12 is available to M. marinum during infection of zebrafish. Systemic infection of zebrafish embryo with M. marinum was established by injection of 50–200 CFU bacteria into the caudal vein. All bacterial strains carry a plasmid expressing RFP (tdtomato). The embryos were imaged at 4 days post-infection. (A) The level of infection was quantified by counting the pixels of red fluorescent signal per embryo. Strains: by WT, cobC::fs, cobC::fs-metH::fs, and cobC::fs-metE::fs; NI, noninfected. Significant changes in each group were determined by ANOVA testing. P > 0.05, not significant, not indicated. *P < 0.05; **P < 0.01; ***P < 0.001. (B) Representative pictures of the infected embryos; red pixels correspond to bacteria. |

Increased B12 uptake capacity in the hypermutating nucS-cobC-metEparental mutant. (A) Gradient plates containing 100 ng/mL B12 on 7H10 agar plates. (B) Selected colonies growing on regular and gradient plates containing 100 ng/mL B12. The marked colony (red asterisk), named ΔnucS cobC-metE-selected, was selected for further analysis. (C) Drop assays of bacteria growing at 0, 5, 25, and 1,000 ng/mL B12. Mutant strains cobC and cobC-metE served as controls. (D) Ethidium bromide (EtBr) uptake experiment to determine membrane permeability. Bacteria were exposed to 10 µg/mL of EtBr, and fluorescence was measured every 3 minutes (ex: 300 nm/em: 605 nm). The nucS-cobC-metE-selected mutant shows higher EtBr uptake compared to the WT and the parental control strains. |
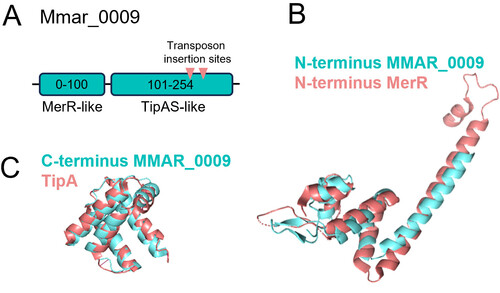
Mmar_0009 encodes for a transcriptional regulator. (A) Protein domain organization of Mmar_0009. The structure homology was predicted by PhyreR2 software and defines two domains. The N-terminal domain is predicted to be MerR-like, belonging to the transcriptional regulator family. The C-terminal domain is predicted as a TipAS-like domain, a type of MerR regulator that responds to thiopeptides. (B) and (C) Structure modeling by Alphafold prediction and structural alignments; in (B), N-terminus Mmar_0009 and N-terminus MerR from Bacillus megaterium (PDB: 4UA1, RMSD 4.756); in (C), C-terminus domain of Mmar_0009 compared with TipA domain of Streptomyces lividans (PDB: 1NY9, RMSD values of 1.534). |

MA plot of the RNA results for mmar_0009 mutant analysis. MA plot showing the Log2 mean expression and Log2 fold change of the differentially expressed genes. Upregulated genes (Log2 FC >2 and false discovery rate <0.005) are displayed in red and downregulated in blue (Log2 FC <2 and false discovery rate <0.005), gray for nondifferentially expressed genes. |