
- Title
-
Syndecan-4 is required for early-stage repair responses during zebrafish heart regeneration
- Authors
- Lai, Z.Y., Yang, C.C., Chen, P.H., Chen, W.C., Lai, T.Y., Lu, G.Y., Yang, C.Y., Wang, K.Y., Liu, W.C., Chen, Y.C., Liu, L.Y., Chuang, Y.J.
- Source
- Full text @ Mol. Biol. Rep.
|

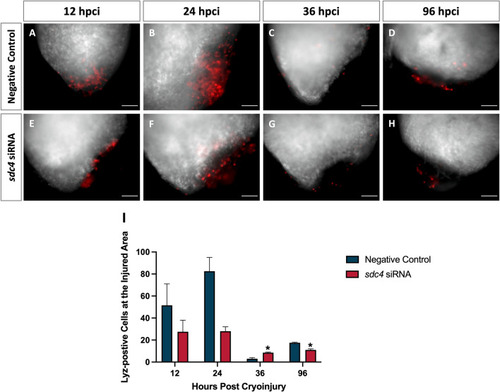
Knockdown of |
Inhibition of |

|

|

|

Pathological Q wave and ST elevation were observed after |