
- Title
-
Intracellular delivery and deep tissue penetration of nucleoside triphosphates using photocleavable covalently bound dendritic polycations
- Authors
- Ma, J., Wehrle, J., Frank, D., Lorenzen, L., Popp, C., Driever, W., Grosse, R., Jessen, H.J.
- Source
- Full text @ Chem Sci

Designed molecule to enable cellular uptake and spatiotemporal control of the release of nucleotides. |

(A) HPLC analysis of the uncaging of DEAC450 caged ATP 6 at 490 nm. Concentration: 100 μM. Volume: 1 mL. (B) Uncaging kinetics of DEAC450 caged ATP 6 at 490 nm. |
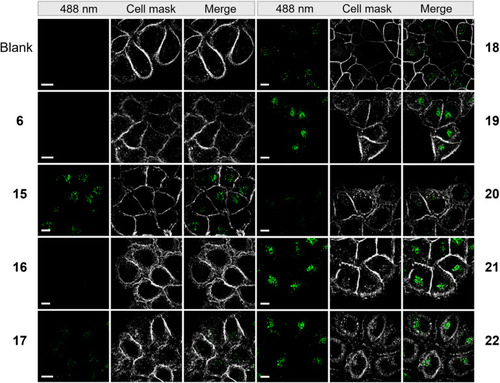
Microscopy images of HeLa cells incubated with 50 μM of compounds from a super resolution Lattice SIM microscope. Scale bar represents 10 μm. |

(A) Colocalization analysis of compounds (G1–NH2–) 19, (G2–NH2–) 21, (G2–guanidine–) 22 with Golgi stain — BODIPY® TR ceramide. Green dots indicate fluorescence generated from compounds. Red color indicates Golgi. The orange color indicates colocalized pixels. (B) Colocalization analysis of compounds (G2–NH2–) 21, (G2–guanidine–) 22 with Golgi stain — BODIPY® TR ceramide at different time points. Green dots indicate fluorescence generated from compounds. Red color indicates Golgi. The orange color indicates colocalized pixels. (C) Colocalization analysis of compounds (G1–NH2–) 19, (G2–NH2–) 21, (G2–guanidine–) 22 with LysoTracker® Deep Red. Green dots indicate fluorescence generated from compounds. Purple dots indicate lysosomes. The white color indicates colocalized pixels. HeLa cells were incubated with 50 μM of compound in the dark at 37 °C for 5 h. Scale bar for the overview represents 10 μm. Scale bar for the inset represents 1 μm. Colocalization indicated as percentage. |

(A) Images of the heads of zebrafish embryos in tissue penetration experiments. Different cross-sections of one embryo for 21 and 22 are shown. Incubation time: 24 h. (B) Images of the heads of zebrafish embryos in tissue penetration experiments. Different cross-sections of one embryo for 21 and 22 are shown. Incubation time: 48 h. Final concentration of applied compounds: 50 μM. Green signals indicate either weak autofluorescence (see (a) blank) or the fluorescence generated from compounds. Scale bar represents 40 μm. (C) Transgenic zebrafish with |

(A) Synthesis of clickable version of DEAC450 3. (B) Synthesis of DEAC450 caged ATP 6. (a) ETT, DMF, r.t., 5 min. (b) |