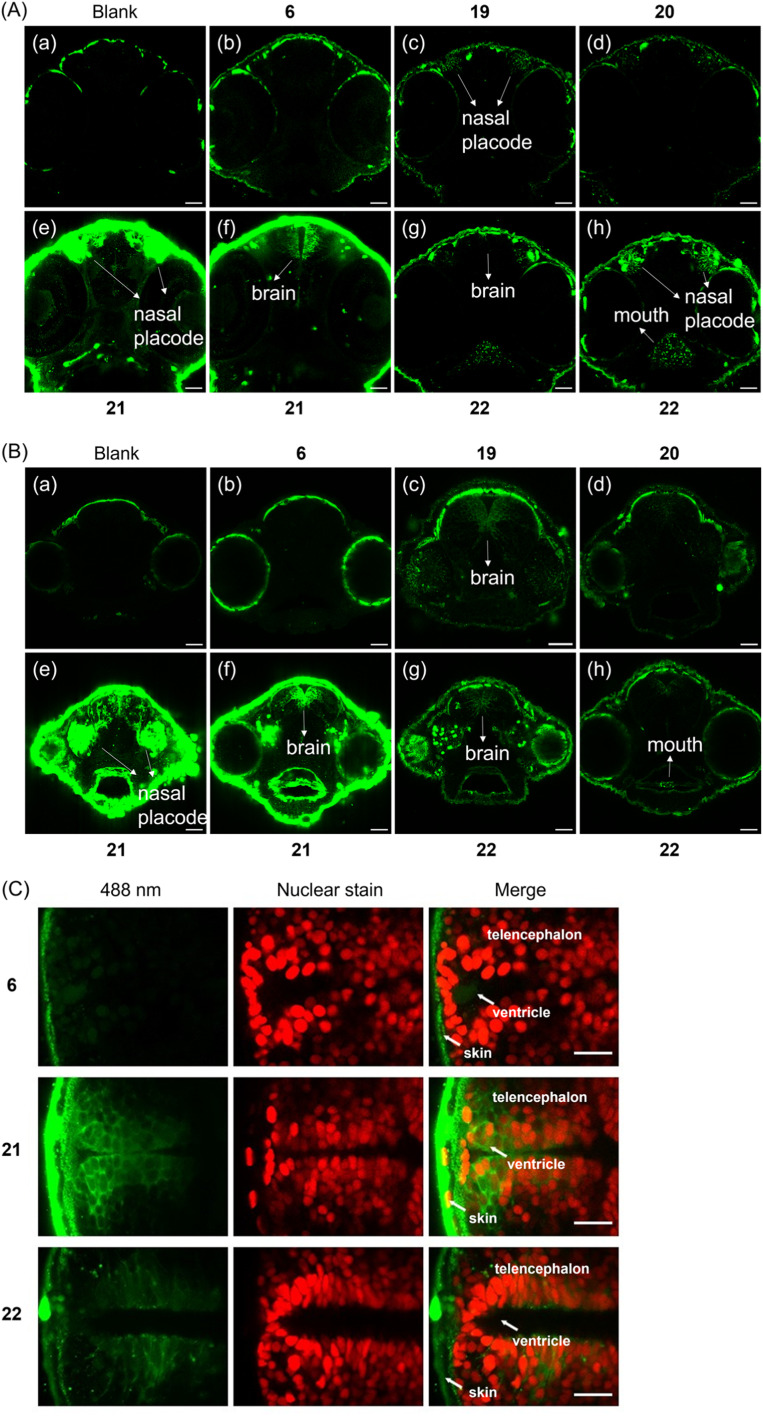
IMAGE

Fig. 5

ID
ZDB-IMAGE-240503-57
Source
Figures for Ma et al., 2024
Image
Figure Caption

Fig. 5 (A) Images of the heads of zebrafish embryos in tissue penetration experiments. Different cross-sections of one embryo for 21 and 22 are shown. Incubation time: 24 h. (B) Images of the heads of zebrafish embryos in tissue penetration experiments. Different cross-sections of one embryo for 21 and 22 are shown. Incubation time: 48 h. Final concentration of applied compounds: 50 μM. Green signals indicate either weak autofluorescence (see (a) blank) or the fluorescence generated from compounds. Scale bar represents 40 μm. (C) Transgenic zebrafish with Tg(sox2: sox2-E2A-QF2)m1517 and Tg(QUAS: nls-mCardinal)m1637 with red fluorescent nuclei in neural stem and progenitor cells were used and treated with 6, 21 and 22 respectively. Incubation time: 48 h. Final concentration of applied compounds: 50 μM. Temp.: 28.5 °C. Scale bar represents 20 μm.

Acknowledgments
This image is the copyrighted work of the attributed author or publisher, and ZFIN has permission only to display this image to its users. Additional permissions should be obtained from the applicable author or publisher of the image. Full text @ Chem Sci