FIGURE SUMMARY
Title

TANGO1 inhibitors reduce collagen secretion and limit tissue scarring

Authors
Raote, I., Rosendahl, A.H., Häkkinen, H.M., Vibe, C., Küçükaylak, I., Sawant, M., Keufgens, L., Frommelt, P., Halwas, K., Broadbent, K., Cunquero, M., Castro, G., Villemeur, M., Nüchel, J., Bornikoel, A., Dam, B., Zirmire, R.K., Kiran, R., Carolis, C., Andilla, J., Loza-Alvarez, P., Ruprecht, V., Jamora, C., Campelo, F., Krüger, M., Hammerschmidt, M., Eckes, B., Neundorf, I., Krieg, T., Malhotra, V.
Source
Full text @ Nat. Commun.

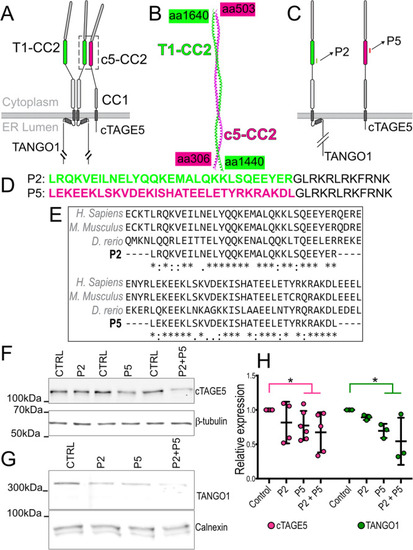
Design of peptides to inhibit TANGO1-cTAGE5 heterodimerization.

A The organization and the domains of TANGO1 and cTAGE5. Each of these proteins contains two cytoplasmic coiled-coil domains. TANGO1 coiled-coil 2 (T1-CC2) is highlighted in green. cTAGE5 CC2 in magenta. B Alphafold2 prediction of the structure of the heterodimer of TANGO1 (green) and cTAGE5 (magenta). C Schematic indicating where the peptide sequences map to in TANGO1 and cTAGE5. D Two peptides were synthesized of 30 (P2) and 31 (P5) amino acids respectively, conjugated to a 12 amino-acid C-terminal lysosomal escape motif (shown in black text). E Alignment of human, mouse, and zebrafish sequences. F Representative western blot of U2OS cell lysates treated with P2, P5 or P2 + P5, probed for cTAGE5. β-tubulin was used as a loading control. G Representative Western blot of U2OS cell lysates treated with P2, P5 or P2 + P5, probed for TANGO1. Calnexin was used as a loading control. H Quantification of blots showing TANGO1 (green) and cTAGE5 (magenta) levels (mean +/- SD) in control or peptide-treated cells (normalized to control) *p < 0.05, Student’s t test comparing cTAGE5 (magenta line) or TANGO1 (green line) in control vs treated. N = 3 (TANGO1), N = 5 (cTAGE5).

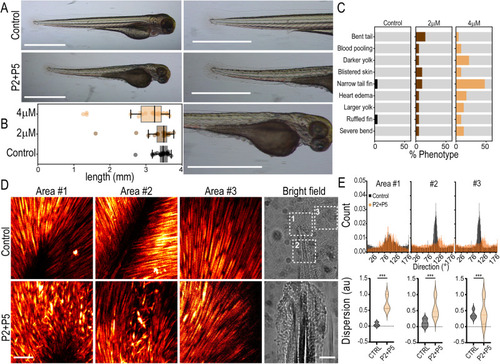
Peptides induce phenotypic changes in zebrafish consistent with TANGO1/cTAGE5 inhibition.

A Zebrafish larvae at 3 dpf. Fish were treated with P2 + P5 (4 μM), or left untreated in E3 (control). Magnified images of the tail and yolk on the right. Scale bars 1 mm. B Quantification of larva length from head to tail (boxplot with median and interquartile range N = 21, 19, 23 in control, 2 μM and 4 μM respectively). Whiskers connect the maximum and minimum. C Quantification of phenotypes observed in fish for n = 21, 19, 23 replicates in control, 2 μM and 4 μM respectively, from three independent experiments. D Maximum projection of the entire Z-stack of SHG images from three different tail fin regions (Areas #1, 2, 3) as indicated in the bright-field images. Images were acquired from three control and treated fish each, with approximately similar regions of the tail chosen as Area #1, 2, and 3. Scale bars 100 μm. E Quantification of collagen fiber direction obtained from the SHG signal in the three segmented areas approximately represented in (D) Top row: Collagen fiber direction histograms from a representative control or treated fish. Bottom row: Collagen fiber dispersion distribution plots from a representative control or treated fish. This measure represents the dispersion of the preferred orientation of collagen fibers in the image. Control measurements are represented in black and P2 + 5 (4 μM) is treated in orange. Kolmogorov–Smirnov test *** p < 0.001.

Uptake of fluorescently labeled peptides into primary human dermal fibroblasts and inhibition of procollagen I secretion.

A Confocal micrographs of primary human dermal fibroblasts showing uptake of P2 + P5 supplied at 40 μM over 20 h in serum-free conditions. Co-staining with an ER marker in red. Bar: 10 μm. B Quantification of uptake of fluorescent peptides (N = 4, mean  +/−  SD of intracellular fluorescent intensity). C, D Representative western blot (C) and quantification of fibroblast lysates treated or not (Ctrl) with P2 + P5 at 40 μM for 20 h. N = 6 (D). E, F Representative western blot from supernatants; Ponceau staining reflects the loading control in the corresponding cell lysates (E). Quantification of supernatants of human fibroblasts treated for 20 h in serum-free conditions with either P2 or P5 at the indicated concentration. N = 6 (F). G, H Representative western blot from supernatants; Ponceau staining reflects the loading control in the corresponding cell lysates (G). Quantification of supernatants from untreated and P2 + P5 treated skin fibroblasts. N = 24; Mann– Whitney U test, two-tailed, **** p < 0.0001 (H). I Protein concentration of untreated and P2 + P5 treated cell lysates. N = 9. J Duration, in hours, of inhibitory effect after removal of P2 + P5. Levels of untreated (Ctrl) were set at 100%. N = 3 per time point, two-way ANOVA with Sidak’s multiple comparisons test. *** p < 0.0001. K Collagen I western blot of supernatants from controls and scrambled (scr) peptide-treated control fibroblasts and β actin western blot from corresponding cell lysates. L Determination of cytotoxicity of control fibroblasts treated with different peptides (measured by lactate dehydrogenase release (L, D, H)). N = 17 (Ctrl)/7 (P2)/7 (P5)/9 (P2 + P5)/8 (P2 scr + P5 scr). N = independent samples. Data shown as mean ± SD.

Effects of peptide treatment on the secretome of human fibroblasts.

A Volcano plot illustrating significantly downregulated (blue symbols) and upregulated (orange symbols) proteins, by treatment of primary human dermal fibroblasts with 40 μM P2 + P5 for 20 h in serum-free conditions in comparison to control samples. Unpaired two-sided Student´s t-test, S0 = 0.1, N = 3 independent samples. B Gene ontology (GO) terms of proteins affected by peptide treatment. Box plot represents the median, 25th and 75th percentiles, max. and min. are connected through whiskers. Outliers are defined as Q1−1.8 interquartile range (IQR) and Q3 + 1.8 IQR. An unpaired two-sided Student´s test was performed.

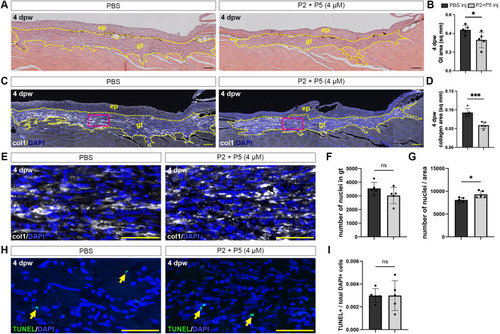
Peptides limit the formation of granulation tissue in zebrafish wounds.

A H&E staining of skin longitudinal sections at 4 dpw from control PBS-treated fish (left), or those treated with P2 + P5 (right). Granulation tissue (gt) area was measured (yellow dashed lines). B Quantification of granulation tissue area in control or peptide-treated animals. * p = 0.0369. C Immunohistochemical analysis of collagen deposition during wound healing in the granulation tissue in control (left) or peptide-treated (right) animals. D Quantification of collagen area in the granulation tissue. *** p = 0.0006. E Higher magnification of immunohistochemical analysis of collagen deposition and nuclei (magenta boxes in C). F Quantification of total nuclei within the granulation tissue. G Quantification of total nuclei divided by the granulation tissue area. * p = 0.0198. H TUNEL staining of 4 dpw wounds in granulation tissue in control (left) or peptide-treated (right) animals. I Quantification of TUNEL-positive cells divided by total DAPI-positive cells in the granulation tissue. Scale bars: A, C = 200 μm; E, H = 50 µm. ep: epidermis. N = 5 fish per treatment, Student’s t-test, two-tailed. Non-significant (NS). Data are shown as mean ± SD.

Peptides inhibit ECM protein secretion by TGFβ-activated healthy and scleroderma fibroblasts.

A Western blot of supernatants from fibroblasts incubated for 20 h in the absence of serum without (Ctrl) or with 40 μM each of P2 + P5 and without or with 10 ng/ml TGFβ. Peptide treatment strongly reduced amounts of secreted (pro)collagen I (top), fibrillin1 (mid) and fibronectin (bottom) in fibroblasts from healthy donors and scleroderma patients before and particularly after stimulation of ECM production by TGFβ. B Quantification of (A). N = 3 independent samples. Data are shown as mean ± SD.

Acknowledgments
This image is the copyrighted work of the attributed author or publisher, and ZFIN has permission only to display this image to its users. Additional permissions should be obtained from the applicable author or publisher of the image. Full text @ Nat. Commun.