The adult zebrafish telencephalon is characterized by an extensive cell type diversity.

a Cell collection strategy to enrich for RG. b tSNE of all cells colored by their broad cell type annotation. q quiescent, p proliferating. c Expression of marker genes in refined non-RG cell clusters. Each color-coded column is a cluster and each line is a gene. Each bar represents one cell and the height of the bar reflects the level of expression of the gene.

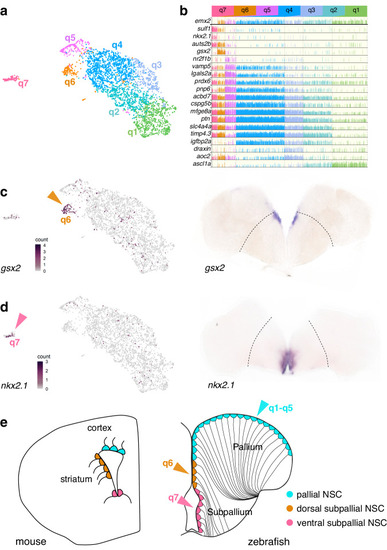
qRG in the zebrafish adult telencephalon are spatially patterned.

a UMAP of qRG (green cluster from Fig. 1b) colored by terminal cluster identity. b Expression of marker genes across qRG clusters, highlighting cluster-specific, regional and quiescence markers. c, d Orthologs of ganglionic eminences markers (gsx2, nkx2.1) projected on zebrafish UMAP (left, color-coded arrows matching (a) and (b)) and with ISH on coronal slices of the adult zebrafish telencephalon (right). Dashed lines indicate the boundary between pallium and subpallium. e, Homologies of ventricular territories between zebrafish and mouse telencephalon (coronal sections) inferred from expression of regionalized transcription factor genes such as emx2, gsx2 and nkx2.110,94,95. Depicted cells are RG, colored by their developmental origin (color-coded relative to clusters).

Conservation and variations in the evolution of the adult neurogenic cascade in vertebrates.

a Plots displaying scores (see Materials and Methods) identifying astroglial cells, metabolically active cells and neuroblasts in zebrafish, salamander, lizard and mouse. The ribosomal score is used here to represent an upregulation in genes involved in protein synthesis, which is associated with a switch from quiescence to activation in stem cells, as well as with proliferation and early post-mitotic cells. Additional illustrations explaining how cell populations were selected can be found at https://entrepot.recherche.data.gouv.fr/privateurl.xhtml?token=bede1d62-f7cf-4e85-b6ce-05121176f108. b Schematic delineating which cell populations were selected for further analysis: in pink: qRG, identified by a high Glial Score and low Ribosomal and Neuroblast Scores; in green: paRG, identified by high Glial and Ribosomal Scores and a low Neuroblast Score, and in blue: neuroblasts, identified by a low Glial Score and high Ribosomal and Neuroblast Scores. Proliferating cells were purposefully left out of this comparative analysis because non-glial progenitors and proliferating glia could not be readily identified in all datasets. c Phylogenetic tree depicting the profiled vertebrate species and reconstructed gene expression along the neurogenic cascade for selected genes. A grey square represents no or low expression, an orange square represents intermediate level of expression, and a red square represents high expression. Black squares represent genes that are either not present in the genome (igfbpl1 in zebrafish) or for which it is impossible to distinguish between actual lack of expression or lack of detection due to scRNA-seq. NB: newly born postmitotic neurons, paRG: pre-activated RG close to entering the cell cycle, qRG: quiescent RG.

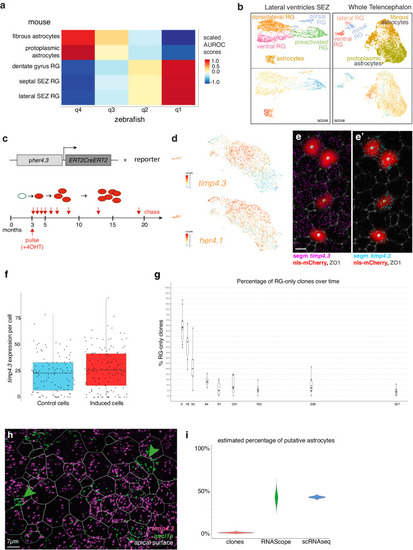
Transcriptomic and functional homologies between quiescent NSCs in zebrafish and mammalian astrocytes.

a Cluster mapping between zebrafish dorsal RG (this study) and astroglia in the mouse telencephalon. Colors: scaled AUROC scores. b Scoring of mouse astroglial cells from10 (left) and53 (right) for genes enriched in zebrafish q4 over q2. Top: annotated clustering of astroglia from each dataset. Bottom: Enrichment score for orthologs of genes overexpressed in zebrafish q4 over q2. c Scheme of the clonal recombination and chase times used to assess the neurogenic potential of q4 RG. d UMAP comparing timp4.3 and her4.1 expression in qRG. Colors: variable counts. e, f, Quantitative analysis of timp4.3 expression in clones at 6dpi. e,e’, Representative image of recombined cells (mCherry immunohistochemistry -IHC-, red, large spot) in Dm (ZO1 IHC, white, to delimit apical NSC surfaces), with whole-mount RNAscope for timp4.3. timp4.3 dots are segmented in all apical cells (e, magenta) or shown only in recombined clones (e’, cyan). Scale bar 5 μm. ftimp4.3 expression (number of dots) in non-recombined (control) vs recombined (induced) cells at 6dpi (see Source Data file). For each boxplot: lower and upper bounds: 25th and 75th percentiles, internal line: median, whiskers extend to the extrema. Individual values overlaid as black dots. n = 135 and 103 for induced and control cells respectively. Statistical comparison: Two-sided Mann-Whitney U test, p:0.07; effect size: Cliff’s delta (0.14) with a 95% confidence interval (−0.01, 0.28). g Proportion of clones per hemisphere containing only RG over time. Boxplots drawn as in f. n = 10, 6, 5, 4, 6, 11, 9, 10, 11 clone-containing hemispheres at 6, 18, 30, 64, 91, 125, 183, 308, 507 days respectively (see Source Data file). h Representative image of smISH for ascl1a (green) and timp4.3 (magenta) in adult zebrafish Dm (dorsal view). ZO1 IHC delimits apical NSC surfaces (dotted lines). Scale bar 7 μm. i Boostrapped estimate of the proportion of RG-only clones after a 507-day chase (red), versus proportions of q4 cells, estimated in situ with RNAScope (green) or in scRNAseq (blue).

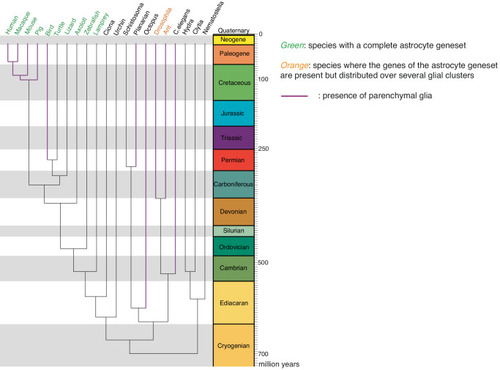
Emergence of the astrocytic synapomere

Phylogenetic tree depicting the expression of the astrocytic synapomere in analyzed species and whether parenchymal glia with supportive functions have been described in those species. Leaves in magenta represent phyla in which parenchymal glial cells have been previously described. Species in green co-express several genes of the astrocytic synapomere in the same glial cell clusters. Species in orange express several genes from the astrocytic synapomere but spread out across several glial cell clusters. Species in black do not seem to rely on the astrocytic synapomere. Time scale in million years.

Acknowledgments
This image is the copyrighted work of the attributed author or publisher, and ZFIN has permission only to display this image to its users. Additional permissions should be obtained from the applicable author or publisher of the image. Full text @ Nat. Commun.