FIGURE SUMMARY
Title

Unraveling the evolutionary origin of the complex Nuclear Receptor Element (cNRE), a cis-regulatory module required for preferential expression in the atrial chamber

Authors
Nunes Santos, L., Sousa Costa, Â.M., Nikolov, M., Carvalho, J.E., Coelho Sampaio, A., Stockdale, F.E., Wang, G.F., Andrade Castillo, H., Bortoletto Grizante, M., Dudczig, S., Vasconcelos, M., Rosenthal, N., Jusuf, P.R., Nim, H.T., de Oliveira, P., Guimarães de Freitas Matos, T., Nikovits, W., Tambones, I.L., Figueira, A.C.M., Schubert, M., Ramialison, M., Xavier-Neto, J.
Source
Full text @ Commun Biol

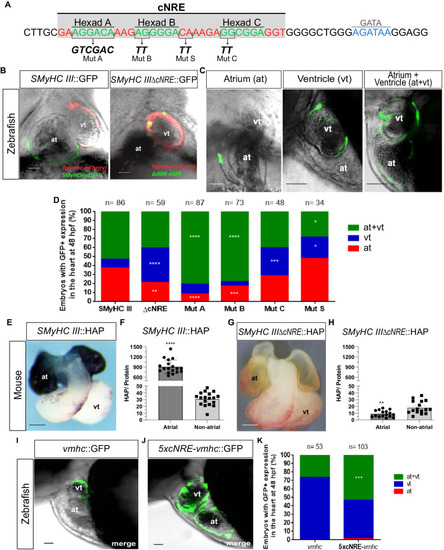
The cNRE drives expression in atrial cells. Mutational analysis of the SMyHC III promoter in zebrafish reveals a dual role in atrial activation and ventricular repression.

A Schematic representation of the SMyHC III promoter sequence highlighting the position of the cNRE sequence and mutated sites. B Confocal images in frontal views, anterior to the top, of a representative zebrafish embryo. Ventricular expression is demonstrated by overlapping eGFP expression driven by  SMyHC IIIΔcNRE and stable mCherry fluorescence driven by the ventricular stable line. C Representative panel of eGFP expression patterns in cardiac chambers of zebrafish embryos in lateral views, anterior to the left, injected with SMyHC III::eGFP. (at) atrium. (vt) ventricle. D Graphic representation of eGFP chamber expression patterns of cohorts of embryos injected with SMyHC III::eGFP, SMyHC IIIΔcNRE::eGFP, and constructs containing point mutations in the cNRE Hexads A, B, and C (Mut A, B, and C, respectively) as well as a non-Hexad control mutation (Mut S). Embryos were analyzed at 48 h post-fertilization (hpf) and classified into three categories of cardiac expression patterns: exclusive atrium (at), exclusive ventricular (vt), and atrium plus ventricular (at+vt). chi-square test, ΔcNRE: **p = 0.0026; ****p < 0.0001, Mut A: ****p < 0.0001, Mut B: ***p = 0.0002; ****p < 0.0001, Mut C: ***p = 0.0005, Mut S: *p = 0.0388 (vt); *p = 0.0116 (at+vt), comparing SMyHC III to each mutation and condition. E Frontal views, anterior is to the top, mouse embryos. SMyHC III::HAP (line 5, n = 18) isolated heart at 10.5 days post coitum (dpc), showing intense, dark blue, atrial coloring indicative of conspicuous HAP expression. F HAP assays in homogenates of atrial and non-atrial cardiac tissues in SMyHC III::HAP (n = 18), unpaired t test, p < 0.0001. GSMyHC IIIΔcNRE::HAP (line 110, n = 16) isolated heart at 10.5 dpc, showing absence of HAP expression. H HAP assays in homogenates of atrial and non-atrial cardiac tissues in the SMyHC IIIΔcNRE::HAP mutant (n = 16), unpaired t test, p = 0.0013. I Confocal image in lateral view, anterior is to the left, of a representative zebrafish embryo. Exclusive ventricular eGFP expression is observed at 48 hpf when injected with the vmhc promoter. J Confocal image in lateral view, anterior is to the left, of a representative zebrafish embryo. Expression of eGFP is detectable in both heart chambers at 48 hpf when injected with the 5xcNRE-vmhc construct. K Graphical analysis of chamber expression patterns of the cohort of embryos injected with vmhc or 5xcNRE-vmhc promoter constructs. (at) atrium. (vt) ventricle. chi-square test, p < 0.05, comparing vmhc::eGFP and 5xcNRE-vmhc::eGFP embryos for each condition. Scale bars are 30 µm.

Point mutations in Hexads B and C affect HAP expression in the mouse heart.

A Strategy for the mutation of Hexad A (Mut A). B Mouse line 14 (Mut A) at 10.5 days post coitum (dpc), showing atrial-specific expression of HAP. C Strategy for the mutation of Hexad B (Mut B). D Mouse line 17 (Mut B) at 10.5 dpc, showing expression of HAP. EG Time course (10.5 dpc to 12.5 dpc) of cardiac expression in both chambers (atrium and ventricle) in mouse line 17 (Mut B). H Comparison of HAP assays in homogenates of atrial and non-atrial cardiac tissues from Mut B line 17 (n = 38) and SMyHC III line 5 (n = 18) in 10.5 dpc embryos, one-way ANOVA with Bonferroni post-hoc test, ****p < 0.0001. I Strategy for the mutation of Hexad C (Mut C). J Mouse line 5 (Mut C) at 9.5 dpc. K Isolated heart from the SMyHC III::HAP line at 10.5 dpc. L Isolated heart from a wild-type littermate at 10.5 dpc. M Isolated heart from mouse line 5 (Mut C) at 10.5 dpc. N Comparison of HAP assays in homogenates of atrial and non-atrial cardiac tissues from Mut C line 5 (n = 15) and SMyHC III line 5 (n = 18) in 10.5 dpc embryos, one-way ANOVA with Bonferroni post-hoc test, ****p < 0.0001. O Strategy for the mutation of the non-Hexad control (Mut S) in the spacer sequence between Hexads B and C. P Representative mouse line 14 (Mut S) at 10.5 dpc, showing atrial-specific HAP expression.

Comparison of cNRE mutations between zebrafish and mice.

ASMyHC III promoter in (A′) zebrafish and (A″) mice. B cNRE deletion in (B′) zebrafish and (B″) mice. C Mutation of Hexad A (Mut A) in (C′) zebrafish and (C″) mice. D Mutation of Hexad B (Mut B) in (D′) zebrafish and (D″) mice. E Mutation of Hexad C (Mut C) in (E′) zebrafish and (E″) mice. F Mutation of the spacer sequence between Hexads B and C (Mut S) in (F′) zebrafish and (F″) mice. Zebrafish hearts in lateral views and mouse hearts in frontal view. (at) atrium. (vt) ventricle. Illustration created with BioRender.com.

SMyHC III is part of a strongly supported subfamily of galliform-specific myosins.

Phylogenetic analysis of the Myosin Heavy Chain (MYH) 6, 7, and 7B families in representative species of archosaurians. Maximum Likelihood tree of archosaurian MYH6, MYH7, and MYH7B proteins with branch support (Bootstrap percentages/Bayesian posterior probabilities) indicated at each node. “--” indicates that the node is not supported by Bayesian Inference. The tree is midpoint rooted and branch lengths correspond to sequence substitution rates.
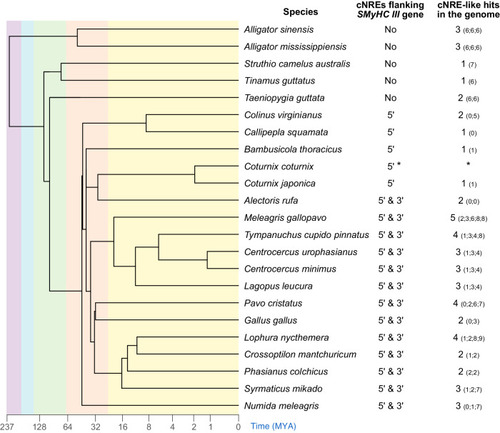
cNREs flank the SMyHC III genes of galliform birds.

Phylogenetic tree of representative species of archosaurians, showing the presence (or absence) of cNREs in the 5′ and 3′ flanking regions of SMyHC III genes as well as the number of cNRE-like hits in the entire genome. Numbers in brackets represent the number of mismatches for each of the cNRE-like sequences relative to the Coturnix coturnix 5′ cNRE sequence. “*” indicates that the complete sequence of the SMyHC III locus is not available for Coturnix coturnix.

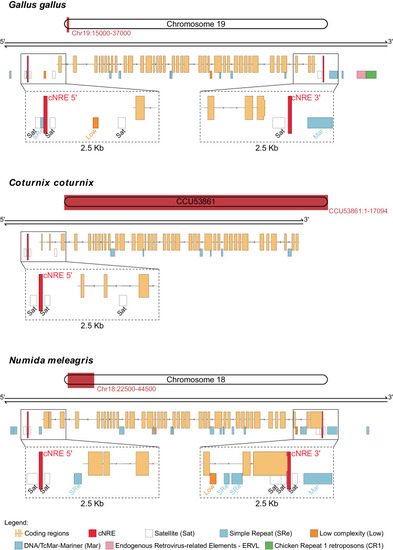
cNREs are closely associated with the 5′ and 3′ ends of SMyHC III genes in galliform birds.

Schematics showing representative genomic location of cNREs and repeat sequences (obtained by RepeatMask analysis) near the SMyHC III genes (indicated in brown) in three galliform species: Gallus gallus, Coturnix coturnix, and Numida meleagris. The regions shown are Gallus gallus GalGal5.0 Chromosome 19: 15,000–37,000, Coturnix coturnix U53861 complete sequence, and Numida meleagris NumMel1.0 Chromosome 18: 22500-44500. The results show that, for each of the three species, one copy of the cNRE (red) is flanking the SMyHC III gene at both its 5′ and 3′ end. Note that the cNREs are distinct from satellite (Sat), simple repeat (SRe), low complexity (Low), and transposon sequences.

cNRE-like sequences are found in viral genomes.

Alignment of the original cNRE with cNRE-like sequences identified in different viruses. Different shades of blue indicate the level of conservation of a given nucleotide in the alignment.

Acknowledgments
This image is the copyrighted work of the attributed author or publisher, and ZFIN has permission only to display this image to its users. Additional permissions should be obtained from the applicable author or publisher of the image. Full text @ Commun Biol