
- Title
-
A realistic mixture of ubiquitous persistent organic pollutants affects bone and cartilage development in zebrafish by interaction with nuclear receptor signaling
- Authors
- Guerrero-Limón, G., Zappia, J., Muller, M.
- Source
- Full text @ PLoS One
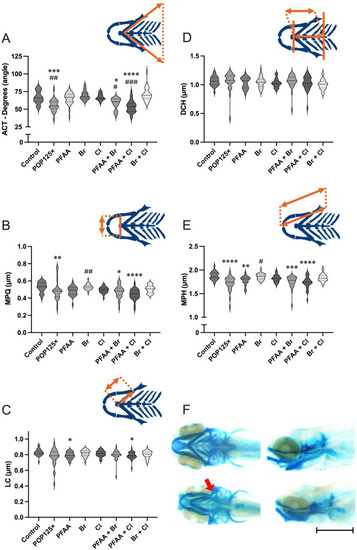
Morphometric analysis of the chondrocranium in 5dpf zebrafish larvae exposed to POP mixtures A) Aperture of the angle between ceratohyals (ACT), B) Distance between the left and right Meckel’s cartilages/palatoquadrates (MPQ), C) Length of the Ceratohyal (LC), D) Distance between the frontal end of the ceratohyals and the line connecting the posterior ends of the hyosymplectics (DCH); E) Combined distance covering the entire Meckel’s cartilage, palatoquadrate, and the hyosymplectics (MPH); F) Alcian blue staining of controls (upper pictures) and larvae exposed to POP125× (Bottom pictures), bar represents 1 mm. Kruskal-Wallis with Dunn’s multiple comparison test. |

Prevalence of craniofacial defects and examples of such defects. (A) Percentage of fish presenting craniofacial defects, (B-D) Examples of phenotypes used to catalogue fish in each category: (B) normal, (C) mild, (D) severe phenotype. The scale bar represents 200 μm. |

Area of the opercle in fish stained with alizarin red at 10 dpf. (A, B) Live alizarin red stained fluorescent image of a control larva (A) and a larva treated with PFAA+Br (B) (lateral view, anterior to the left). Arrows point at the area of the opercle outlined in the images. The scale bar represents 500 μm. (C) Opercle area measured in control larvae and larvae upon treatment with the indicated mixture ( |
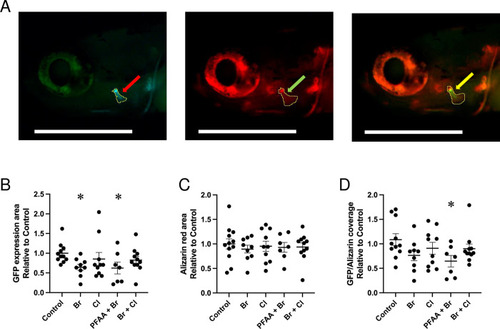
GFP staining in (A) Example of an individual control larva illustrating the green fluorescence of the |

Networks of genes coding for nuclear receptors differentially expressed upon exposure to the total POP mixture. Networks were generated on Cytomine using GENEMANIA annotations. The nodes represent genes, the fill colors indicate the log2(fold-change) upon POP125× exposure, while the rim circle color gives the log2(fold-induction) due to POP75× exposure. All genes are upregulated in a dose-dependent way. The edges (connecting lines) represent links between nodes, based on “Shared protein domains” in the zebrafish network (left), or on specific interactions and pathways as indicated for the human network (right). |

Networks of genes involved in collagen synthesis and differentially expressed upon exposure to the total POP mixture. Networks were generated on Cytomine using GENEMANIA annotations. The nodes represent genes, the fill colors indicate the log2(fold-change) upon POP125× exposure, while the rim circle color gives the log2(fold-induction) due to POP75× exposure. All genes are down-regulated in a dose-dependent way. The edges (connecting lines) represent links between nodes, based on “Shared protein domains” and “Co-expression” in the zebrafish network (left), or on specific interactions and pathways as indicated for the human network (right). |

Molecular fingerprints organized in hierarchical agglomerative nesting clusters. Dendrogram revealing the chemical fingerprint similarity relations between reference compounds and the components of the POP mixture (29 compounds). |

Schematic diagram of the effects of POP125× on skeletal development. Represented is the bone-forming osteoblast cell, originating from pre-osteoblastic, mesenchymal cells through expression of regulatory genes such as |