
Image
|
Figure Caption
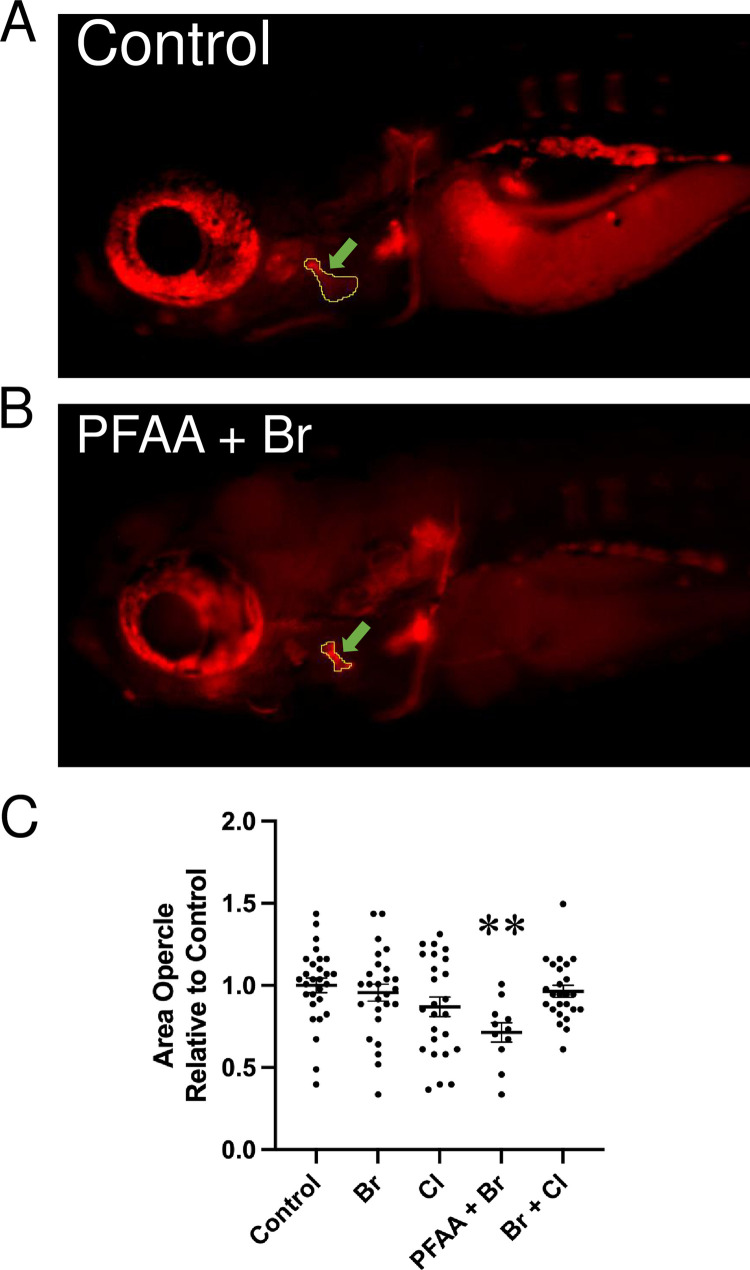
Fig 3 Area of the opercle in fish stained with alizarin red at 10 dpf.
(A, B) Live alizarin red stained fluorescent image of a control larva (A) and a larva treated with PFAA+Br (B) (lateral view, anterior to the left). Arrows point at the area of the opercle outlined in the images. The scale bar represents 500 μm. (C) Opercle area measured in control larvae and larvae upon treatment with the indicated mixture (
Acknowledgments
This image is the copyrighted work of the attributed author or publisher, and
ZFIN has permission only to display this image to its users.
Additional permissions should be obtained from the applicable author or publisher of the image.
Full text @ PLoS One