- Title
-
Pcgf5: An important regulatory factor in early embryonic neural induction
- Authors
- Yang, X., Zhou, W., Zhou, J., Li, A., Zhang, C., Fang, Z., Wang, C., Liu, S., Hao, A., Zhang, M.
- Source
- Full text @ Heliyon
|
Pcgf5 was upregulated during RA-induced neural induction in P19 cells. (A,C) Representative images show immunofluorescence of Sox2 and Oct4 from P19 cells with DMSO (Wild Type) or 0.5 μM RA (RA) induction. Scale bar, 5 μm. (B,D) Quantification of (A) and (C). More than 100 cells were counted in each experiment. (E,F,G) qPCR was used to analyse the expression of Zfp521, Pax6 and Oct4, Nanog and Pcgf5 during RA induction. (H,I) Western Blot was used to detect the level of Pcgf5 during RA induction. Full-length gels before cropping are noted in Fig. S4. Data are presented as means ± SEM of at least three independent experiments. (E-G,I), ** (p < 0.01),*** (p < 0.001), **** (p < 0.0001), ns: no significance. |
|
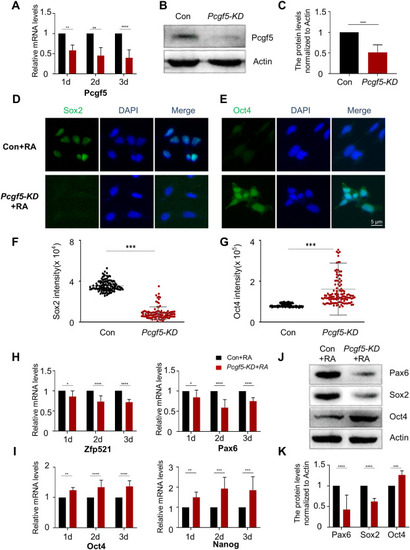
Pcgf5 is involved in the regulation of RA-induced neural induction in P19 cells. (A-C) qPCR and Western Blot was used to analyse the interference efficiency of Pcgf5. (D,E) Representative images show immunofluorescence of Sox2 and Oct4 from Con and Pcgf5-KD after 0.5 μM RA induction. Scale bar, 5 μm. (F,G) Quantification of (D) and (E). More than 100 cells were counted in each experiment. (H,I) Following the knockdown of Pcgf5, qPCR was utilized to evaluate the expression of Zfp521, Pax6 and Oct4, Nanog. (J,K) Western Blot was used to detect the expression of Pax6, Sox2 and Oct4 after Pcgf5 knockdown. Full-length gels before cropping are noted in Fig. S5. Data are presented as means ± SEM of at least three independent experiments (A,C,H–I,K), * (p < 0.05), ** (p < 0.01),*** (p < 0.001), **** (p < 0.0001). |
|
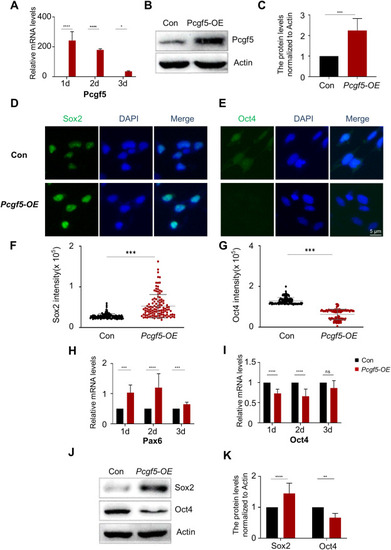
Overexpression of Pcgf5 gene promotes the neural induction process in P19 cells. (A-C) qPCR and Western Blot was used to analyse the overexpression level of Pcgf5. Full-length gels before cropping are noted in Fig. S6. (D,E) Representative images show immunofluorescence of Sox2 and Oct4 from WT and Pcgf5-OE without RA induction. Scale bar, 5 μm. (F,G) Quantification of (D) and (E). More than 100 cells were counted in each experiment. (H,I) Following the overexpression of Pcgf5, qPCR was utilized to evaluate the expression of Pax6 and Oct4. (J,K) Western Blot was used to detect the expression of Sox2 and Oct4 after Pcgf5 overexpression. Full-length gels before cropping are noted in Fig. S6. Data are presented as means ± SEM of at least three independent experiments (A,C,H -I,K), * (p < 0.05), ** (p < 0.01),*** (p < 0.001), **** (p < 0.0001), ns: no significance. |
|
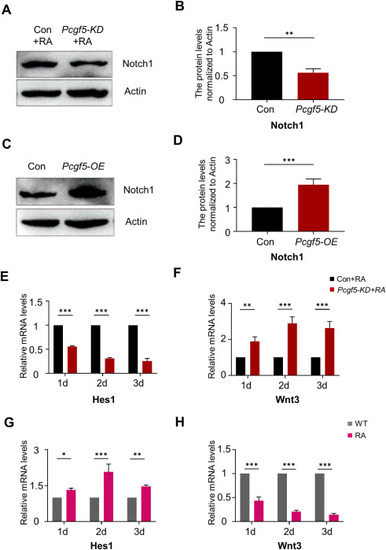
Pcgf5 participates in the neural induction process by regulating Notch1. (A-D) Western Blot was used to detect the expression of Notch1 after Pcgf5 knockdown or overexpression. Full-length gels before cropping are noted in Fig. S7. (E,F) Following the knockdown of Pcgf5, qPCR was utilized to evaluate the expression of Hes1 and Wnt3. (G,H) qPCR was used to analyse the expression of Hes1 and Wnt3 during RA induction in P19 cells with DMSO (Wild Type) or 0.5 μM RA (RA) induction. Data are presented as means ± SEM of at least three independent experiments (B,D,E-H), ** (p < 0.01),*** (p < 0.001) |
|
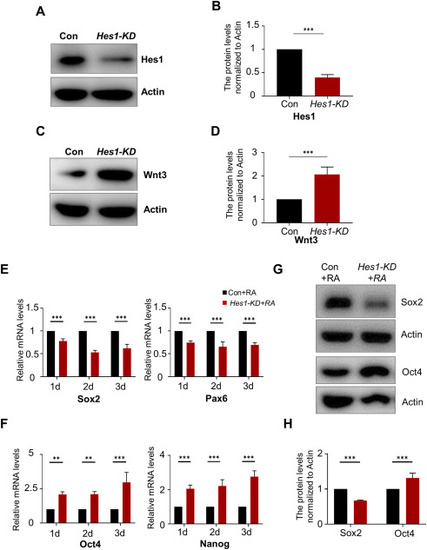
Hes1 plays a crucial role in neural induction by acting as a suppressor of Wnt3 gene expression. (A, B) Western Blot was used to analyse the interference efficiency of Hes1. Full-length gels before cropping are noted in Fig. S8. (C,D) Western Blot was used to detect the expression of Wnt3 after Hes1 knockdown. Full-length gels before cropping are noted in Fig. S8. (E,F) Following the knockdown of Hes1, qPCR was utilized to evaluate the expression of Sox2, Pax6 and Oct4, Nanog. (G,H) Western Blot was used to detect the expression of Sox2 and Oct4 after Hes1 knockdown. Full-length gels before cropping are noted in Fig. S8. Data are presented as means ± SEM of at least three independent experiments (B,D,E,F,H), ** (p < 0.01), *** (p < 0.001). |
|
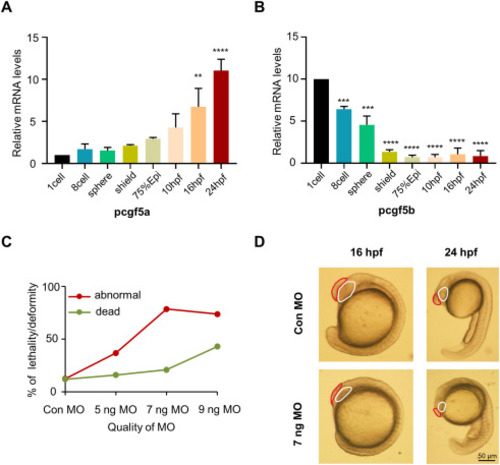
Knockdown of pcgf5a expression results in abnormal early embryonic development in zebrafish. (A-C) qPCR and Real-time PCR was used to detect the expression of pcgf5a and pcgf5b in zebrafish embryos at different periods, from the 1-cell stage to 24 hpf. (D) A dose-dependent statistical graph of the embryo phenotype, and 7 ng MO was selected as the appropriate injection dose. (E) The phenotypes of zebrafish embryos taken under light microscope at 16 hpf and 24 hpf stage. Red markers show that the brain size of the pcgf5a-deficient zebrafish embryos is obviously smaller, and white markers show that the eye vesicles of the pcgf5a-deficient zebrafish embryos are smaller and the eye morphology is abnormally developed. Scale bar, 50 μm. PHENOTYPE:
|
|
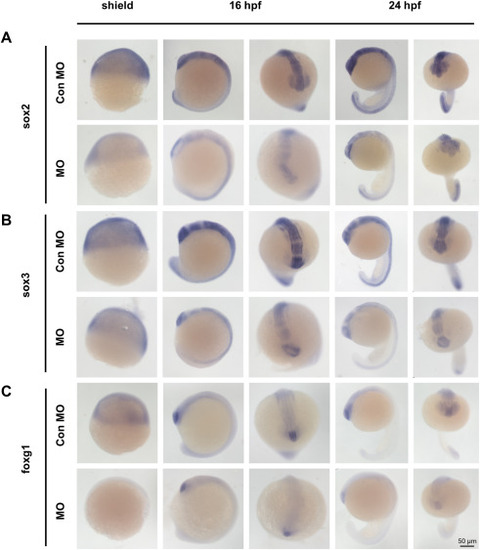
pcgf5a is involved in the regulation of early embryonic neurodevelopment of zebrafish. (A-C) Images show the expression of sox2, sox3 and foxg1 revealed by in situ hybridization. Scale bar, 50 μm. |


