FIGURE SUMMARY
Title

Knockdown of Kmt2d leads to growth impairment by activating the Akt/β-catenin signaling pathway

Authors
Shangguan, H., Huang, X., Lin, J., Chen, R.
Source
Full text @ G3 (Bethesda)

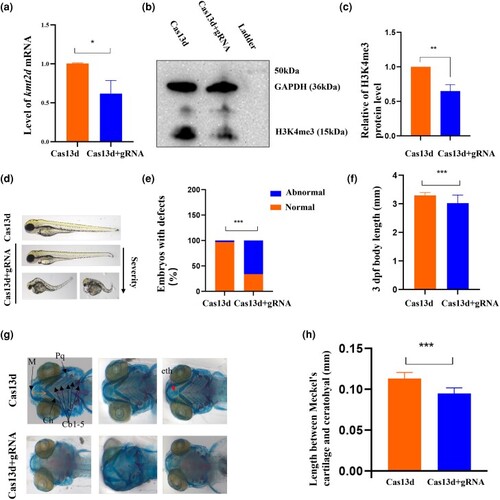
The influence of kmt2d deficiency in zebrafish embryos. a) Fifteen embryos per biological replicate were collected for zebrafish qRT-PCR at 6 h post injection. b and c) The level of the H3K4me3 protein. The band density was quantified and expressed as the relative gray value (compared with the control) by arbitrarily setting the control value as 1. Data were pooled from 3 independent experiments, and the results were represented as mean ± SD. d and e) Abnormal phenotypes including small eyes, curved body, pericardial effusion, mandibular deformity, slight tail curvature, and shortened yolk extension were observed in 3 dpf stage. n = 35 for each group. f) Body length was reduced in the kmt2d knockdown zebrafish. n = 19 for each group. g) Dysplasia formation in Meckel’s cartilage, ceratohyals, and ethmoid bones in the embryos with a co-injection of Cas13d mRNA and 3 gRNAs. n = 7 for each group. h) Quantification of length between Meckel’s cartilage and ceratohyal. kmt2d knockdowns were shorter when compared with those of control embryos. n = 7 for each group. eth, ethmoid plate; Cb, ceratobranchial; Ch, ceratohyal; M, Meckel’s cartilage; Pq, palatoquadrate. Scale bar: b) 1,000 μm; e) 500 μm. *P < 0.5, **P < 0.001, ***P < 0.0001.

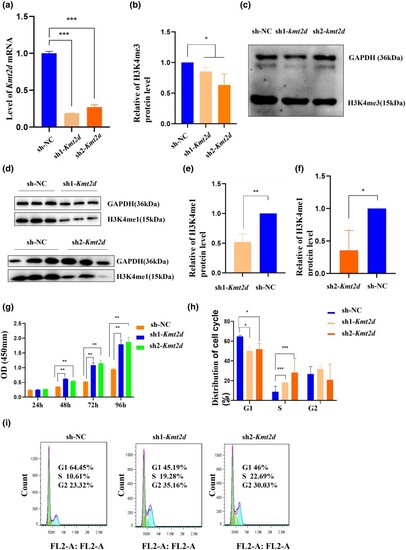
Kmt2d knockdown promoted ATDC5 cell cycle progression and proliferation in vitro. a) The level of Kmt2d mRNA in the ATDC5 cells. b–f) The levels of H3K4me1 and H3K4me3 proteins. The band density was quantified and expressed as the relative gray value (compared with the control) by arbitrarily setting the control value as 1. Data were pooled from 3 independent experiments, and the results were represented as mean ± SD. g) CCK-8 assay was performed to measure the proliferation of ATDC5 cells. The proliferation of the cells was enhanced in the knockdown of Kmt2d groups. h and i) Cell distribution in the G1, S, and G2/M phases of the sh-NC cells compared with those of the sh-Kmt2d cells. *P < 0.05, **P < 0.001, ***P < 0.0001.

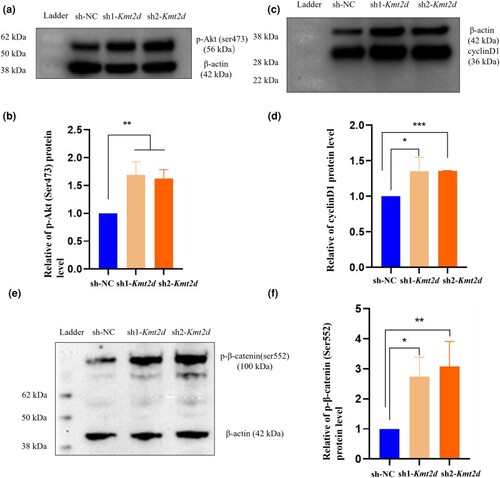
Kmt2d knockdown resulted in Akt/β-catenin pathway activation in vitro. a and b) The relative p-Akt (Ser473) protein level decreased in the knockdown group. c and d) The relative p-β-catenin (Ser552) protein level decreased in the knockdown group. e and f) The relative cyclin D1 protein level decreased in the knockdown group. The band density was quantified and expressed as the relative gray value (compared with the control) by arbitrarily setting the control value as 1. Data were pooled from 3 independent experiments, and the results were represented as mean ± SD. *P < 0.05, **P < 0.001, ***P < 0.0001.

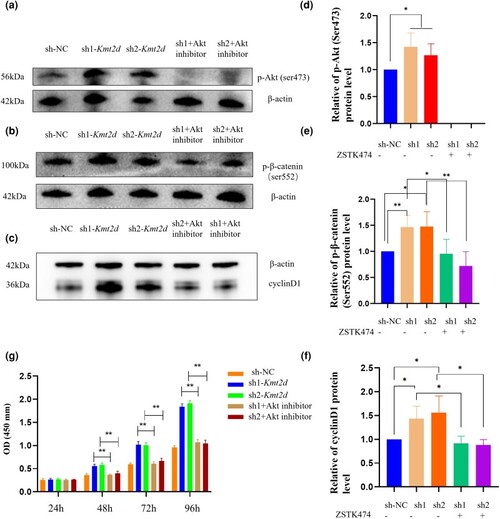
The effect of Akt inhibition on β-catenin signaling in the group of Kmt2d knockdown chondrocytes. a–f) Cells in the groups of sh1-Kmt2d and sh2-Kmt2d were pretreated with ZSTK474 (5 μmol). The cell lysates of each group were prepared and probed for p-Akt (Ser473), p-β-catenin (Ser552), and cyclin D1 by western blot. The band density was quantified and expressed as the relative gray value (compared with the control) by arbitrarily setting the control value as 1. Data were pooled from 3 independent experiments, and the results were represented as mean ± SD. g) The enhanced cell proliferation caused by a low expression of Kmt2d could be partly reversed by Akt inhibition. *P < 0.05, **P < 0.001.

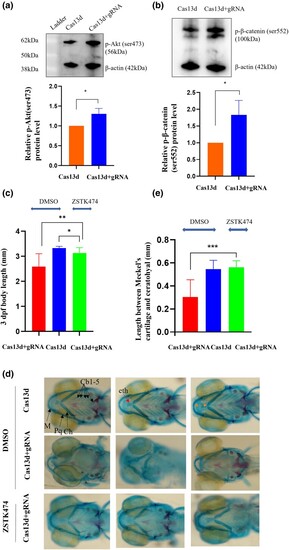
The growth delay and chondrocyte malformation induced by kmt2d deficiency can be partially alleviated by the inhibition of Akt. a and b) The levels of the p-Akt (ser473) and p-β-catenin (ser552) proteins. The band density was quantified and expressed as the relative gray value (compared with the control) by arbitrarily setting the control value as 1. Data were pooled from 3 independent experiments, and the results were represented as mean ± SD. c) The reduced body length in kmt2d knockdowns was partially alleviated by ZSTK474. n = 10 for each group. d and e) The asymmetrical morphology ceratohyal and Meckel’s cartilage in kmt2d knockdowns was partially corrected. n = 10 for each group. Scale bar: d) 100 μm. *P < 0.05, **P < 0.001, ***P < 0.0001. Cb, ceratobranchial; Ch, ceratohyal; M, Meckel’s cartilage; Pq, palatoquadrate.

Acknowledgments
This image is the copyrighted work of the attributed author or publisher, and ZFIN has permission only to display this image to its users. Additional permissions should be obtained from the applicable author or publisher of the image. Full text @ G3 (Bethesda)