IMAGE

Fig. 2.

ID
ZDB-IMAGE-240307-33
Source
Figures for Shangguan et al., 2024
Image
Figure Caption

Fig. 2.

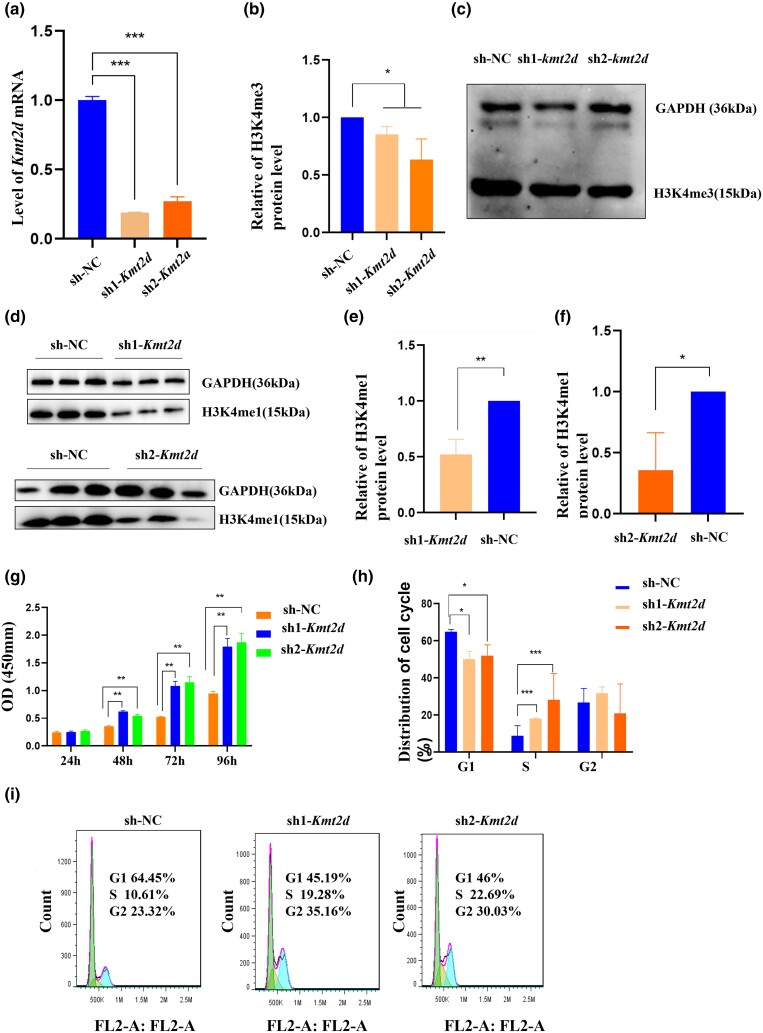
Kmt2d knockdown promoted ATDC5 cell cycle progression and proliferation in vitro. a) The level of Kmt2d mRNA in the ATDC5 cells. b–f) The levels of H3K4me1 and H3K4me3 proteins. The band density was quantified and expressed as the relative gray value (compared with the control) by arbitrarily setting the control value as 1. Data were pooled from 3 independent experiments, and the results were represented as mean ± SD. g) CCK-8 assay was performed to measure the proliferation of ATDC5 cells. The proliferation of the cells was enhanced in the knockdown of Kmt2d groups. h and i) Cell distribution in the G1, S, and G2/M phases of the sh-NC cells compared with those of the sh-Kmt2d cells. *P < 0.05, **P < 0.001, ***P < 0.0001.

Acknowledgments
This image is the copyrighted work of the attributed author or publisher, and ZFIN has permission only to display this image to its users. Additional permissions should be obtained from the applicable author or publisher of the image. Full text @ G3 (Bethesda)