
- Title
-
Genetically encoded lizard color divergence for camouflage and thermoregulation
- Authors
- Sun, B.J., Li, W.M., Lv, P., Wen, G.N., Wu, D.Y., Tao, S.A., Liao, M.L., Yu, C.Q., Jiang, Z.W., Wang, Y., Xie, H.X., Wang, X.F., Chen, Z.Q., Liu, F., Du, W.G.
- Source
- Full text @ Mol Bio Evol
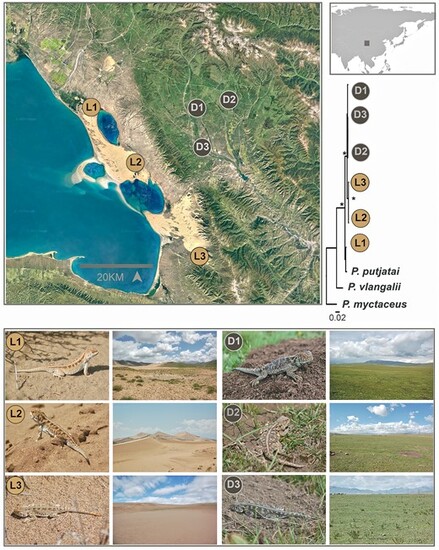
Sample sites, phenotypes, natural habitats, and phylogenetic relationship of six P. putjatai populations. The yellow (L1, L2, and L3) and black (D1, D2, and D3) spots indicate the sample sites of lizards from the dune and alpine meadow habitats, respectively. The photos indicate that the microhabitats for light and dark lizards are significantly different from each other, but are similar to their local microhabitats, respectively. The ML phylogenetic relationship is based on 1,730 bp (partial ND2 and BDNF) sequences. Node strongly supported (BS = 1) is marked with black asterisks. D1 to D3 and L1 to L3 indicate 1 to 3 dark populations (meadow) and 1 to 3 light populations (dune), respectively |

Functional determination of camouflage and thermoregulation in lizards from the dune and alpine meadow populations with different dorsal coloration. a) Reflectance spectra of the natural substrate and dorsal skin of lizards from the dune and meadow populations under natural light in the field. Each line indicates an individual or a natural substrate in the field. b) The difference in reflectance spectra between the natural substrate and dorsal skin of lizards from the dune and alpine meadow populations. Data are shown as mean ± SE. (c) The percentage of lizards attacked by avian and mammalian predators in dune and alpine meadow habitats, respectively. Numbers above the columns indicate the sample size of attacked models against the initial set. d, e) Substrate surface temperatures (Tsurface), air temperatures (Tair), and active body temperatures of lizards (Tb) in natural habitats of alpine meadow and dune. Each diamond indicates a Tb from an active individual, and Tsurface and Tair are shown as mean ± SE. |

Genomic and transcriptomic analysis of the phylogenetic relationship and mechanisms underpinning the dorsal coloration variations in lizards from the dune and alpine meadow populations. a) PCA analysis of the phylogenetic relationship between the dune and meadow populations. The first two axes of PCA for the dune (pink) and meadow (blue) populations are based on 7,146,131 SNPs. b) Individual assignment probability bar plot at the best fit (K = 2), inferred by Admixture and based on 642,957 neutral SNPs. c) The distribution of XP-EHH values that were calculated with a 40-kb window in a 20-kb step size between the dune and alpine meadow populations. The positions of the arrows represent the XP-EHH values of each candidate gene. The black and red dash lines indicate the top 1% and top 5% of XP-EHH, respectively. Notably, only Tyrp1 surpasses the threshold for the top 5% XP-EHH (i.e. 1.61879). d) The percentage of G/G, G/C, and C/C at Tyrp1 459# of lizards from the dune and alpine meadow populations by genomic resequencing. Lizards from the dune population have 100% G/G, while lizards from the meadow population possess G/C (22.22%) or C/C (77.78%) genotypes at Tyrp1 459#. e) The differential expression of five (Tyrp1, Zeb2, Rab1a, Bnc2, and Prep) melanin-generating-related genes. Asterisks indicate a significant difference between the dune and alpine meadow populations. f) Structure and the chemical bonds of the enzyme TYRP1 between the dune and alpine meadow populations. Dash cycles indicate the difference site of 459# between the dune and alpine meadow populations. |

Verification of the effect of Tyrp1 variations on coloration in the zebrafish system. a) Diagram of the TYRP1 catalytic reaction equation. b) The sequencing base peak of constructed Tyrp11376G (light color/dune population) and Tyrp11376C (dark color/alpine meadow population) OE vectors. The base changes are denoted by yellow arrowheads. c) Protein level of Flag-tagged TYRP1 in the WT, Tyrp11376G (light/dune), and Tyrp11376C (dark/meadow) mRNA OE groups detected by western blot. d) Quantification of protein level in (c) by using Gel-Pro analyzer. Data are shown as mean ± SD. ***P < 0.001. e) The representative bright-field images of zebrafish embryo melanin enriched area at 4 dpf in WT, Tyrp11376G and Tyrp11376C mRNA OE groups. The red dashed areas indicate regions with melanin enriched. From left to right panels are lateral, dorsal, and ventral views (scale bar, 200 μm). f) Quantification of relative melanin area of dorsal views in (e) by Image-Pro Plus analyses. Data are shown as mean ± SD. N (WT) = 8, N (Tyrp11376G OE embryo) = 10, N (Tyrp11376C OE embryo) = 10, **P < 0.01, ***P < 0.001. g) Quantification of relative melanin area of ventral views in (e) by Image-Pro Plus analyses. Data are shown as mean ± SD. N (WT) = 10, N (Tyrp11376G OE embryo) =10, N (Tyrp11376C OE embryo) = 10, *P < 0.05, ***P < 0.001. h) Quantification of whole embryo melanin content by using OD 500 absorption assay. Data are shown as mean ± SD. N = 3, *P < 0.05, **P < 0.01. |