
|
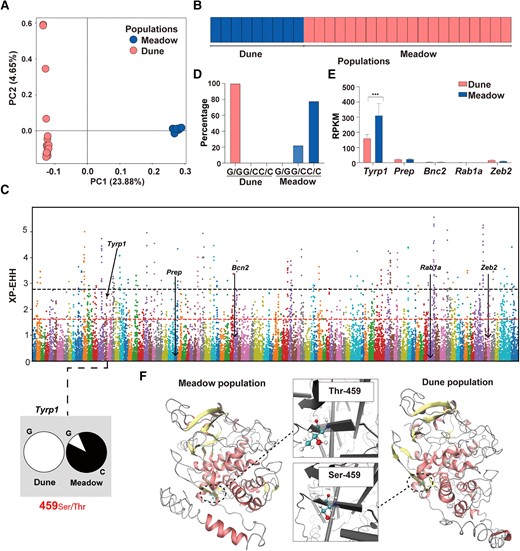
Fig. 3 Genomic and transcriptomic analysis of the phylogenetic relationship and mechanisms underpinning the dorsal coloration variations in lizards from the dune and alpine meadow populations. a) PCA analysis of the phylogenetic relationship between the dune and meadow populations. The first two axes of PCA for the dune (pink) and meadow (blue) populations are based on 7,146,131 SNPs. b) Individual assignment probability bar plot at the best fit (K = 2), inferred by Admixture and based on 642,957 neutral SNPs. c) The distribution of XP-EHH values that were calculated with a 40-kb window in a 20-kb step size between the dune and alpine meadow populations. The positions of the arrows represent the XP-EHH values of each candidate gene. The black and red dash lines indicate the top 1% and top 5% of XP-EHH, respectively. Notably, only Tyrp1 surpasses the threshold for the top 5% XP-EHH (i.e. 1.61879). d) The percentage of G/G, G/C, and C/C at Tyrp1 459# of lizards from the dune and alpine meadow populations by genomic resequencing. Lizards from the dune population have 100% G/G, while lizards from the meadow population possess G/C (22.22%) or C/C (77.78%) genotypes at Tyrp1 459#. e) The differential expression of five (Tyrp1, Zeb2, Rab1a, Bnc2, and Prep) melanin-generating-related genes. Asterisks indicate a significant difference between the dune and alpine meadow populations. f) Structure and the chemical bonds of the enzyme TYRP1 between the dune and alpine meadow populations. Dash cycles indicate the difference site of 459# between the dune and alpine meadow populations.