FIGURE SUMMARY
Title

The structure of TRAF7 coiled-coil trimer provides insight into its function in zebrafish embryonic development

Authors
Song, X., Hu, R., Chen, Y., Xiao, M., Zhang, H., Wu, S., Lu, Q.
Source
Full text @ J. Mol. Cell Biol.

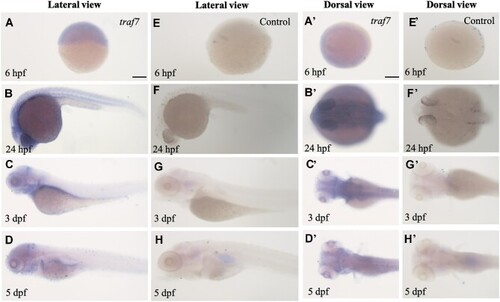
Spatiotemporal expression of traf7 in zebrafish development. (AD and A'–D') WISH staining delineates zebrafish traf7 expression in the brain during early embryonic development. Lateral view (AD) and dorsal view (A'–D') of the zebrafish larvae at different stages. Scale bar, 200 μm. (EH and E'–H') The control group without traf7-specific riboprobe.

Knockdown of Traf7 causes developmental defects in zebrafish. (A) Gross morphology of zebrafish embryos after traf7 ATG-MO injection. The images were taken at 3 dpf. The morphology of the uninjected and control-MO groups appear normal, whereas the embryos injected with traf7 ATG-MO show body defects, including unconsumed yolk sac, microcephaly, curved body axis, pericardial edema, and short body. (B) The embryos were divided into five categories according to the severity of the body defects (normal, mild, moderate, severe, and dead). (C) Injection of traf7 ATG-MO into embryos reduces Traf7 protein levels (***P < 0.01). (D and E) Knockdown of Traf7 affects neuronal development in the Tg(huC:RFP) zebrafish line, as indicated by the reduced fluorescence intensity (n = 5 embryos per group, *P < 0.05). (F and G) Knockdown of Traf7 induces neural cell death. The intense fluorescent apoptotic foci in the spinal cord were detected by the TUNEL assay at 3 dpf (n = 6 embryos per group, ****P < 0.0001).

Overall structure of TRAF7 CC region. (A) Schematic diagram showing the domain organization of TRAF7: a RING domain, a ZF domain, a CC domain, and seven WD40 repeats. (B) Ribbon diagram representation of the TRAF7 CC crystal. The crystal was obtained using TRAF7 fragment 270–379 aa, and prominent electronic cloud density was observed in residues E285–L377. TRAF7 CC forms a parallel trimer, presented here with three chains in green, magenta, and cyan. (C) MALS measurement of TRAF7 CC (fragment 270–379 aa) and TRAF7 ZF-CC (fragment 221–379 aa) showing that the measured molecular weights align with trimeric TRAF7 in solution. Theoretical molecular weights of the trimers: TRAF7 CC, 42.3 kDa; TRAF7 ZF-CC, 59.1 kDa. (D) Sequence alignment of human TRAF CC regions across paralogs, revealing low sequence similarity between human TRAF7 CC and human TRAF1–6 CC. The letters a–g below the TRAF7 sequence are the residue positions of the heptad repeats in the CC region. (E) Sequence alignment of TRAF7 CC regions across species, demonstrating high sequence identity in human, rat, chicken, frog, and zebrafish.

Structure validation and analysis of TRAF7 CC region. (A) Helical net diagram of one helical strand of TRAF7 CC trimer. One hendecad repeat is highlighted in the dashed box. The residues in the a/d positions of the heptad repeats and those in the a/d/x positions of the hendecad repeat are marked in yellow. (B) Combined ribbon and stick-ball models of TRAF7 CC to show the trimer interfaces. The main chains are shown as ribbons, and the side chains of hydrophobic and charged residues are shown as tick balls. (C) The surface charge distribution of TRAF7 CC. Many charged residues with large side chains are distributed on the trimer surface to protect the hydrophobic core. (D) Close-up view of L322 and L347 in the trimer interfaces. These hydrophobic residues are at the d positions, vital to form the trimeric core. (E) MALS measurement of TRAF7 CC molecular weights. A comparison with the wild-type TRAF7 CC (WT) shows lower molecular masses for both L322R and L347R mutants, indicating a weakening of the trimeric structure in solution. TRAF7 CC proteins (WT and mutant) were TrxA-tagged at the N-terminus for this experiment. The theoretical molecular weight of the WT trimer is 84.9 kDa.

TRAF7 CC is involved in human diseases. (A) Close-up view of K346 and R371 in the trimer interfaces. K346 is at the c position, and R371 is at the g position. (B) MALS measurement of molecular weights of wild-type TRAF7 CC (WT) and the K346E and R371G mutants. (C) Close-up view of Q310L, F337S, and I368S in the trimer interfaces. Q310 is at the f position, F337 is at the a position, and I368 is at the d position. (D) MALS measurement of TRAF7 CC molecular weights of WT and the Q310L, F337S, and I368S mutants. The elution peaks of F337S and I368S are shifted to the right.

CC region mutant TRAF7 fails to rescue developmental defects in traf7 ATG-MO-injected zebrafish embryos. (A) Rescue using zebrafish wild-type Traf7 (zTraf7), human wild-type TRAF7 (hTRAF7), and human TRAF7 CC region mutants (hTRAF7-CCD, hTRAF7-K346E, and hTRAF7-R371G). Red arrows indicate malformation features. Scale bar, 1 mm. (B) Morphological phenotype of living embryos after rescue at 3 dpf.

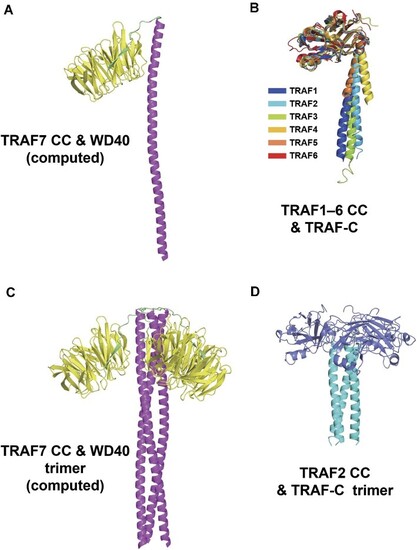
C-terminal structural alignment of TRAF family members. (A) AlphaFold-predicted structure of TRAF7 CC and WD40 domains. The CC region (288–374 aa) is a long α-helix colored magenta, while WD40 (385–670 aa) is colored yellow. (B) Alignment of crystal structures of TRAF1–6 CC and TRAF-C regions. TRAF1–4 and TRAF6 are from humans, and TRAF5 is from mice. TRAF1–5 are homotrimers in crystals, which only show monomers. PDB ID: TRAF1, 5E1T; TRAF2, 1CA9; TRAF3, 1FLK; TRAF4, 3ZJB; TRAF5, 4GJH; TRAF6, 1LB4. (C) TRAF7 CC and WD40 trimer generated by AlphaFold2.3.1 with TRAF7 homotrimer input. (D) TRAF2 CC and TRAF-C trimer from the crystal structure (PDB ID: 1CA9). The CC domain (311–347 aa) is an α-helix colored cyan. The TRAF-C domain (352–501 aa) is colored slate blue.

Acknowledgments
This image is the copyrighted work of the attributed author or publisher, and ZFIN has permission only to display this image to its users. Additional permissions should be obtained from the applicable author or publisher of the image. Full text @ J. Mol. Cell Biol.