FIGURE SUMMARY
Title

Rescue of bmp15 deficiency in zebrafish by mutation of inha reveals mechanisms of BMP15 regulation of folliculogenesis

Authors
Zhai, Y., Zhang, X., Zhao, C., Geng, R., Wu, K., Yuan, M., Ai, N., Ge, W.
Source
Full text @ PLoS Genet.

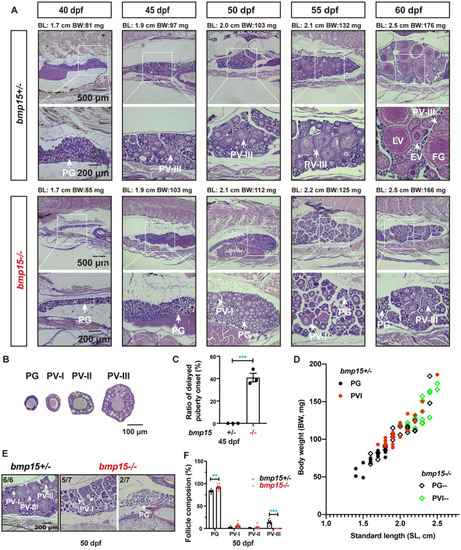
Delayed follicle activation and puberty onset in bmp15-deficient females.

(A) Phenotype analysis of the early follicle development and PG–PV transition in control (
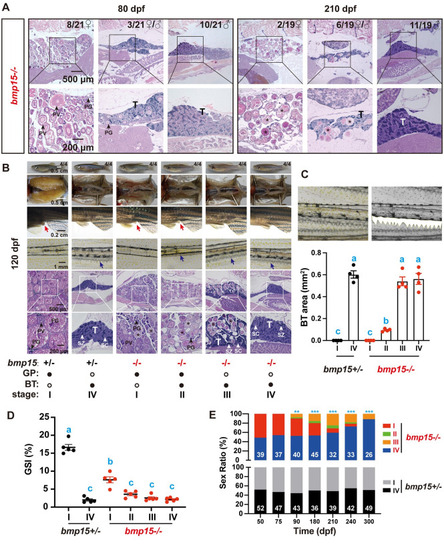
bmp15+/-) and mutant (bmp15-/-) fish at prepubertal and pubertal stage (40–60 dpf). The boxed areas are shown at higher magnification below. The BL (cm) and BW (mg) of each fish are shown on the top. In control fish (bmp15+/-), PV follicles containing cortical alveoli started to appear when their BL and BW reached the threshold for puberty onset (1.80 cm and/or 100 mg). However, PV follicles did not appear in many bmp15 mutant individuals although their body size had reached the threshold. (B) Classification of PV follicles. According to the size and number of layers of the cortical vesicle, the PV stage can be further divided into three sub-stages: PV-I, PV-II and PV-III. (C) Delayed puberty onset in the mutant (bmp15-/-) fish at 45 dpf (3 batches of samples with 18, 31 and 31 fish respectively). The female fish that reached or exceeded the thresholds (1.8 cm and/or 100 mg) but contained no PV follicle were considered to have delayed onset of puberty. The values are expressed as mean ± SEM and analyzed by t-test (*** P < 0.001; n = 3). (D) Correlation between PG-PV transition and body size [BL (cm) and BW (mg)]. Dots in different color represent different stages of follicles. The thresholds in control females were 1.8 cm and/or 100 mg while the thresholds in the mutant were 2.2 cm and/or130 mg. (E) Histological analysis of the control and mutant fish at 50 dpf. All individuals (n = 6) in the control group had reached PV-III stage, while some of the mutants could only grow to PV-I and/or PV-II stage (5/7) and others remained in the PG stage (2/7). (F) Analysis of follicle composition at 50 dpf (n = 7). Compared with the control, the bmp15-/- ovary contained significantly more PG follicles but less PV-III follicles. The values are expressed as mean ± SEM and analyzed by ANOVA followed by the Tukey HSD for multiple comparisons (** P < 0.01; *** P < 0.001).

Sex reverse in bmp15-deficient females.

(A) Histology analysis of the mutant (bmp15-/-) at 80 and 210 dpf. In addition to degenerating ovaries, individuals with ovotestes (♀/♂) were increasingly observed from 80 to 120 dpf, indicating a female-to-male sex reversal. Asterisk, degenerating oocytes; T, testicular tissue. (B) Morphology, gross anatomy, secondary sexual characteristics (GP and BTs) and gonadal histology. The genital papilla (GP, red arrow) was prominent at the cloaca in females while the breeding tubercles (BTs, blue arrows) were present on the pectoral fins of males. T, testicular tissue; SC, spermatocytes; SZ, spermatozoa. (C) Quantification of BT areas in the control and bmp15 mutant undergoing different stages of sex reversal (stage I-IV). The white color marks the BT area for quantification. Stage I and IV represent female and male respectively whereas stage II and III represent transitional stages of sex reversal. The values are expressed as mean ± SEM (n = 4) and analyzed by ANOVA followed by Tukey HSD for multiple comparisons. Different letters indicate statistical significance (P < 0.05). (D) Gonadosomatic index (GSI, gonad weight/body weight) of the control (bmp15+/-) and mutant (bmp15-/-) fish at 120 dpf. The GSI of stage I mutant was significantly lower than in the control. The values are expressed as mean ± SEM (n = 5) and analyzed by ANOVA followed by the Tukey HSD for multiple comparisons. Different letters indicate statistical significance (P < 0.05). (E) Change of sex ratios during gonadal development in bmp15+/- and bmp15-/- fish from 50 to 300 dpf. The sex ratios in control fish were around 50:50 (♂: ♀) at all times examined; however, intersexuality started in the mutant around 90 dpf with increasing males (stage IV). The data were analyzed by Chi-squared test compared with the control (** P < 0.01; *** P < 0.001).

Partial rescue of bmp15 deficiency by inha mutation.

(A) Histological examination of gonads at 120 dpf. The follicle development was arrested at PV–EV transition in bmp15-/- females while the double mutant (bmp15-/-;inha-/-) resumed vitellogenic growth to MV stage, not FG stage as seen in inha-/-. (B) Follicle distribution in different genotypes at 120 dpf. The diameters of bmp15 mutant follicles could reach the size of PV stage (~250 μm), while the double mutant (bmp15-/-;inha-/-) follicles could grow beyond PV to reach MV stage (~450 μm). (C) Serum levels of E2 and Vtg in different genotypes at 120 dpf. The E2 and Vtg levels were significantly lower in bmp15-/- females than those in the control, and they were both returned to normal levels in the double mutant (bmp15-/-;inha-/-). The values are expressed as mean ± SEM (n = 5) and analyzed by ANOVA followed by the Tukey HSD for multiple comparisons. Different letters indicate statistical significance (P < 0.05).

Transcriptome analysis of bmp15 and inha-deficient follicles.

(A) Heatmap of DGEs among four genotypes of bmp15 and inha mutants. The heatmap of bmp15-/-;inha-/- showed similar pattern to that of inha-/- but not bmp15-/-. Regularized log transformed (rlog) count matrix was generated using DeSeq2 package and the DEGs with significance were used to plot the heatmap of rlog counts. (B) Volcano plot for DEGs of bmp15-/-, inha-/- and bmp15-/-;inha-/- compared with bmp15+/+;inha+/+ respectively. Most DEGs in bmp15-/- follicles were down-regulated whereas most DEGs in inha-/- and bmp15-/-;inha-/- were up-regulated.

Expression of selected genes at PG and PV stages in bmp15 mutant.

(A) Stage-matching ovarian samples collected at 60 dpf. Both PG and PV follicles were present in
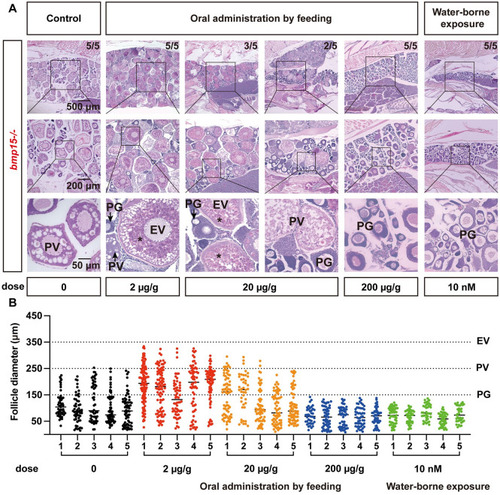
 bmp15+/- and bmp15-/- ovaries. (B) Expression of selected genes at PG and PV stages in bmp15+/- and bmp15-/- fish. The expression of cyp19a1a and inhbaa were dramatically reduced in PV follicles of bmp15-/- fish. cyp19a1a, ovarian aromatase; fshr and lhcgr, FSH and LH receptors; inhbaa, inhbab and inhbb, activin/inhibin β subunits; inha, inhibin α subunit; fsta and fstb, follistatins. The relative mRNA levels were determined by real-time qPCR, normalized to the housekeeping gene ef1a, and expressed as fold change compared with the levels at the PG stage of the control fish. The values are expressed as mean ± SEM (n = 5) and analyzed by ANOVA followed by the Tukey HSD for multiple comparisons (*** P < 0.001; n.s., no significance). (C) Levels of E2 and Vtg in the serum of bmp15+/- and bmp15-/- females at 120 dpf. The E2 and Vtg contents of bmp15-/- were both significantly lower than those in the control. The values are expressed as mean ± SEM (n = 5) and analyzed by t-test (** P < 0.01; *** P < 0.001).

Rescue of vitellogenic growth in bmp15-/- females by E2 treatments.

(A) Histology analysis of the bmp15-/- ovary after E2 treatment. The mutant fish were treated from 80 to 100 dpf by E2 via water-borne exposure (10 nM) or oral administration by feeding (2, 20 and 200 μg/g diet). All five fish fed with E2-containing diet at 2 μg/g resumed vitellogenic growth with yolk mass (asterisk) whereas some fish at 20 μg/g (3/5) contained vitellogenic follicles. Both water-borne exposure and feeding at 200 μg/g suppressed follicle activation or PG-PV transition. The numbers shown in each sample indicate total number of fish sampled (lower) and the number of fish that showed the same phenotype (upper). (B) Follicle distribution in bmp15-/- ovary after E2 treatments. The mutants could break the blockade at PV stage after treatment with E2 at 2 and 20 μg/g diet and their follicles could enter vitellogenic growth to reach the size range of EV stage (~ 350 μm).

Effect of fadrozole on vitellogenic growth in bmp15 and inha double mutant.

(A) Morphology and histology of the double mutant gonads (bmp15-/-;inha-/-) after fadrozole treatment. The females were reared in 10 L tanks from 80 to 100 dpf with dried powder feed containing fadrozole (200 μg/g diet) at 10% (W/W) of fish body weight per day. The resumption of follicle development to vitellogenic stage in the double mutants was completely abolished by treatment with fadrozole. The numbers shown in each sample indicate total number of fish sampled (lower) and the number of fish that showed the same phenotype (upper). (B) Expression of cyp19a1a in the PG and PV follicles of the control and mutants after E2 and fadrozole treatments. (C) Expression of vtg1 and vtg3 in the liver of the control and mutants after E2 and fadrozole treatments at 120 dpf. The relative mRNA levels were determined by real-time qPCR, normalized to the housekeeping gene ef1a, and expressed as fold change compared with the levels in the control fish. (D) Levels of E2 and Vtg in the serum of the control and mutants after E2 and fadrozole treatments. The values are expressed as mean ± SEM (n ≥ 3) and analyzed by ANOVA followed by the Tukey HSD for multiple comparisons. Different letters indicate statistical significance (P < 0.05).

Role of inhbaa in the partial rescue of vitellogenic growth in bmp15-/- by inha-/-.

(A) Morphology and histology of the gonads in different genotypes at 120 dpf. The asterisk shows vitellogenic follicles without yolk mass in the triple mutant (bmp15-/-;inha-/-;inhbaa-/-). (B) Oocytes from diffident genotypes at higher magnification. The oocytes in bmp15-/- single mutant were arrested at PV stage with cortical alveoli (CA) but no yolk granules (YG). The double mutant with inha-/- showed normal vitellogenic growth beyond PV stage with both CA and YG, while the lack of inhbaa in the triple mutant blocked YG accumulation again in the oocytes. The double arrowed bar shows the region of clear cytosol between the germinal vesicle (GV) and CA zone where the YG is supposed to be located. (C) Follicle distribution in the ovary of diffident genotypes. The follicles could grow to the size range of PV (~250 μm), MV (~450 μm) and EV stage (~350 μm) in the single (bmp15-/-), double (bmp15-/-;inha-/-) and triple mutant (bmp15-/-;inha-/-;inhbaa-/-), respectively. (D) GSI of females in different genotypes at 120 dpf. The values are expressed as mean ± SEM (n ≥ 5) and analyzed by ANOVA followed by the Tukey HSD for multiple comparisons. Different letters indicate statistical significance (P < 0.05). (E and F) Serum levels of E2 and Vtg in different genotypes at 120 dpf (n = 5). The normal concentrations of E2 and Vtg in the double mutants decreased again by the loss of inhbaa in the triple mutants. The values are expressed as mean ± SEM and analyzed by ANOVA followed by the Tukey HSD for multiple comparisons. Different letters indicate statistical significance (P < 0.05). (G) Fertility test of different genotypes at 120 dpf. Five female fish from each type were tested 10 times with normal WT males by natural breeding. The number of fertilized eggs was counted and analyzed after each breeding. The inha mutant females were sub-fertile with much lower fecundity than the control, while other genotypes of the mutant females were all infertile. (H) Sex ratios of different genotypes at 120 dpf. The double mutant and triple mutant females could maintain sexuality with sex ratio being around 50:50 (♂: ♀), whereas sex reversal occurred in bmp15-/- fish. I-IV, stages of sex reversal; *** P < 0.001 by Chi-squared test compared with the control.

Expression of selected genes in different genotypes at 120 dpf.

(A) Expression of ovarian genes in the PG follicles (cyp19a1a, fshr, lrp1aa and lrp2a). (B) Expression of Vtg genes in the liver (vtg1-7). (C) Expression of estrogen receptors in the liver (esr1, esr2a and esr2b). (D) Expression of gonadotropins in the pituitary (fshb and lhb). The relative mRNA levels were determined by real-time qPCR, normalized to the housekeeping gene ef1a and presented as the fold change compared with the control fish. Data were analyzed by ANOVA followed by the Tukey HSD for multiple comparisons (* P < 0.05; ** P < 0.01; *** P < 0.001; n ≥ 3). (E) In situ hybridization on the expression of fshb (red) and lhb (green) in the pituitary of different genotypes. DAPI stains for nuclei (blue).

Interaction of bmp15 and gdf9 in zebrafish follicle development.

(A) Histological analysis of bmp15 and gdf9 single and double mutants at 90 dpf. The follicles of some double mutants (gdf9-/-;bmp15-/-) could overcome the blockade at PG to enter early PV (PV-I) stage. (B) Partial rescue of vitellogenic growth in bmp15 and gdf9 single and double mutants by inha-/-. (C) Follicle distribution in different genotypes. Simultaneous mutation of inha-/- could rescue the follicle growth in both bmp15-/- and gdf9-/- to MV stage; however, further loss of inhbaa reduced it to EV stage. (D) Follicle composition in different genotypes and the data are shown as mean ± SEM (n = 3). Statistical analysis was performed with ANOVA followed by Tukey HSD for comparison with corresponding stages in the control fish (* P < 0.05; ** P < 0.01; *** P < 0.001). The proportion of PV-I follicles was significantly higher in the double mutant (gdf9-/-;bmp15-/-) than others especially gdf9-/- single mutant. The proportion of follicles at EV-FG stage (stage III) was lower in the triple mutants than the double mutant (gdf9-/-;bmp15-/-).

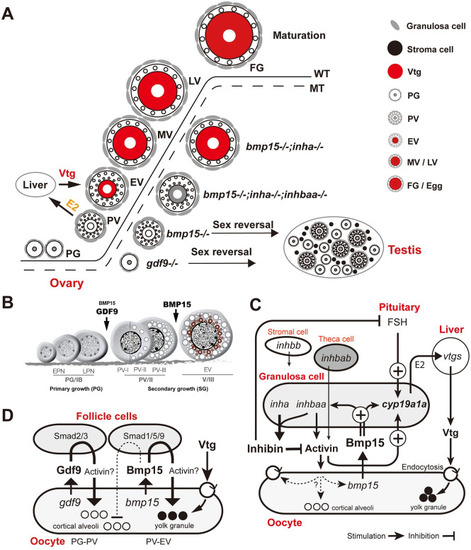
Summary of genetic analysis and working hypotheses on mechanisms of Bmp15 action in zebrafish.

(A) Zebrafish folliculogenesis and phenotypic defects of single (bmp15-/- and gdf9-/-), double (bmp15-/-;inha-/-) and triple (bmp15-/-;inha-/-;inhbaa-/-) mutants. The loss of gdf9 and Bmp15 caused a complete arrest of follicle development at PG and PV stage, respectively. The bmp15-/- follicles showed normal formation of cortical alveoli but no yolk mass in the oocyte, followed by sex reversal to males. Double mutation with inha (bmp15-/-;inha-/-) prevented sex reversal and partially rescued the vitellogenic growth with yolk mass to MV stage. Further knockout of inhbaa in the triple mutant (bmp15-/-;inha-/-;inhbaa-/-) resulted in the loss of yolk granules again but allowed the oocytes to grow to EV size. (B) Roles of Gdf9 and Bmp15 in controlling early follicle development in zebrafish. Gdf9 is primarily involved in controlling PG-PV transition or follicle activation as a determinant; in contrast, Bmp15 is a key factor controlling PV-EV transition, the subsequent stage that marks the start of vitellogenic growth. Bmp15 is also involved in promoting PG-PV transition as an accelerator. EPN, early perinucleolar; LPN, late perinucleolar. (C) Actions and interactions of Bmp15 from the oocyte, activin/inhibin from the follicle cells and FSH from the pituitary in controlling aromatase (cyp19a1a) expression and Vtg biosynthesis as well as uptake. (D) Potential roles for Bmp15 and Gdf9 in regulating formation of cortical alveoli and yolk granules. Gdf9 may stimulate the biogenesis of cortical alveoli in the oocyte, while Bmp15 may play an antagonistic role in this regard while promoting yolk formation.

Acknowledgments
This image is the copyrighted work of the attributed author or publisher, and ZFIN has permission only to display this image to its users. Additional permissions should be obtained from the applicable author or publisher of the image. Full text @ PLoS Genet.