IMAGE

Fig 1

ID
ZDB-IMAGE-231002-45
Source
Figures for Zhai et al., 2023
Image
Figure Caption

Fig 1 
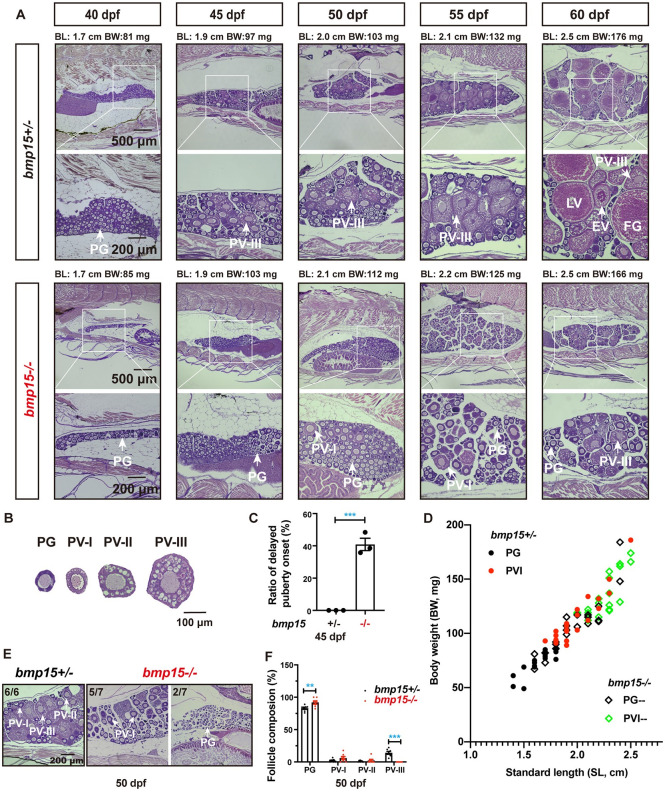
Delayed follicle activation and puberty onset in bmp15-deficient females.

(A) Phenotype analysis of the early follicle development and PG–PV transition in control (bmp15+/-) and mutant (bmp15-/-) fish at prepubertal and pubertal stage (40–60 dpf). The boxed areas are shown at higher magnification below. The BL (cm) and BW (mg) of each fish are shown on the top. In control fish (bmp15+/-), PV follicles containing cortical alveoli started to appear when their BL and BW reached the threshold for puberty onset (1.80 cm and/or 100 mg). However, PV follicles did not appear in many bmp15 mutant individuals although their body size had reached the threshold. (B) Classification of PV follicles. According to the size and number of layers of the cortical vesicle, the PV stage can be further divided into three sub-stages: PV-I, PV-II and PV-III. (C) Delayed puberty onset in the mutant (bmp15-/-) fish at 45 dpf (3 batches of samples with 18, 31 and 31 fish respectively). The female fish that reached or exceeded the thresholds (1.8 cm and/or 100 mg) but contained no PV follicle were considered to have delayed onset of puberty. The values are expressed as mean ± SEM and analyzed by t-test (*** P < 0.001; n = 3). (D) Correlation between PG-PV transition and body size [BL (cm) and BW (mg)]. Dots in different color represent different stages of follicles. The thresholds in control females were 1.8 cm and/or 100 mg while the thresholds in the mutant were 2.2 cm and/or130 mg. (E) Histological analysis of the control and mutant fish at 50 dpf. All individuals (n = 6) in the control group had reached PV-III stage, while some of the mutants could only grow to PV-I and/or PV-II stage (5/7) and others remained in the PG stage (2/7). (F) Analysis of follicle composition at 50 dpf (n = 7). Compared with the control, the bmp15-/- ovary contained significantly more PG follicles but less PV-III follicles. The values are expressed as mean ± SEM and analyzed by ANOVA followed by the Tukey HSD for multiple comparisons (** P < 0.01; *** P < 0.001).

Acknowledgments
This image is the copyrighted work of the attributed author or publisher, and ZFIN has permission only to display this image to its users. Additional permissions should be obtained from the applicable author or publisher of the image. Full text @ PLoS Genet.