
- Title
-
Adverse effects of bifenthrin exposure on neurobehavior and neurodevelopment in a zebrafish embryo/larvae model
- Authors
- Eghan, K., Lee, S., Yoo, D., Kim, C.H., Kim, W.K.
- Source
- Full text @ Chemosphere

Tail coiling (a) recorded at 24 hpf and TER (b) recorded at 72 hpf bifenthrin exposure. The results are shown as mean ± standard deviation (SD) (n = 12). The arrows shown in the figure denote a significant trend of the slope (p: p-value, β: slope). Asterisks (*) indicate significant differences compared with the solvent control (p < 0.05). |
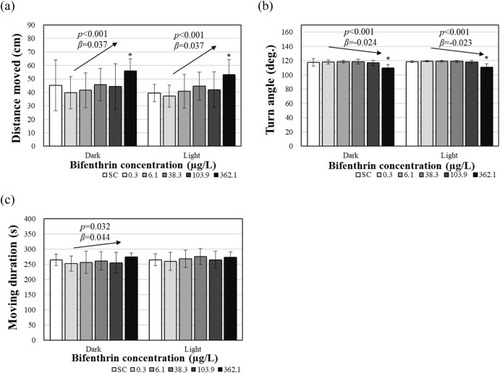
Individual locomotor activity ((a) distance moved, (b) turn angle, and (c) moving duration), of zebrafish larvae after 120 h bifenthrin exposure. The results are shown as mean ± SD (n = 12). The arrows shown in the figure denote a significant trend of the slope (p: p-value, β: slope). Asterisks (*) denote significant deviations from the solvent control (p < 0.05). |

Group locomotor activity ((a) body contact, and (b) distance between subjects of zebrafish larvae) after 120 h bifenthrin exposure. Results are shown as mean ± SD (n = 3, 5 larvae per replicate). For each phase, significant changes were determined. The arrows shown in the figure denote a significant trend of the slope (p: p-value, β: slope). Asterisks (*) denote significant deviations from the solvent control (p < 0.05). |

Levels of AChE (a) and DA (b) after 120 h bifenthrin exposure. The results are shown as mean ± SD (n = 3). The arrows shown in the figure denote a significant trend of the slope (p: p-value, β: slope). Asterisks (*) indicate significant differences compared with the solvent control (p < 0.05). |

Fluorescent images of tg(elavl3:eGFP) (a) line showing brain width (b) and axon width (c) after 120 h bifenthrin exposure. The findings are shown as the mean ± SD (n = 6). The arrows shown in the figure denote a significant trend of the slope (p: p-value, β: slope). Asterisks (*) denote significant deviations from the solvent control (p < 0.05). |

Fluorescent images of tg(mbp:mGFP) line (a) and fluorescent intensity (b) results after 120 h bifenthrin exposure. The findings are shown as the mean ± SD (n = 6). The arrows shown in the figure denote a significant trend of the slope (p: p-value, β: slope). Asterisks (*) denote significant deviations from the control (p < 0.05). |

Gene transcription changes in whole-body homogenates of wildtype zebrafish after 120 h of bifenthrin exposure ((a) neurodevelopment related genes (b) neurotransmitter related genes). The findings are shown as the mean ± SD (n = 4). The arrows shown in the figure denote a significant trend of the slope (p: p-value, β: slope). Asterisks (*) denote significant deviations from the solvent control (p < 0.05). |

|