
Image
|
Figure Caption
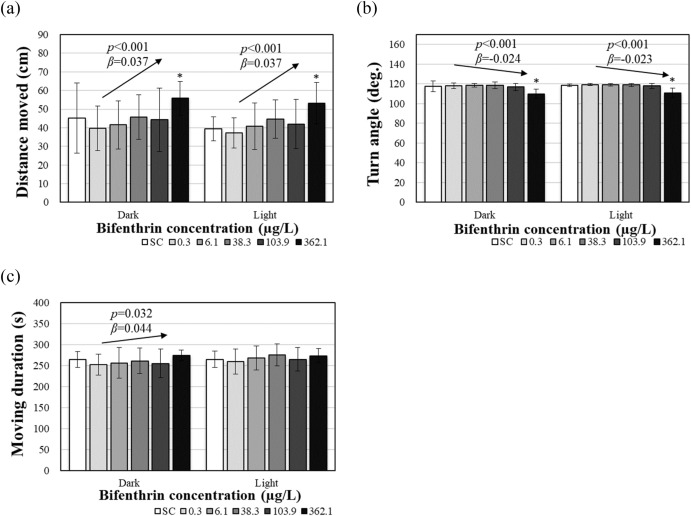
Fig. 2 Individual locomotor activity ((a) distance moved, (b) turn angle, and (c) moving duration), of zebrafish larvae after 120 h bifenthrin exposure. The results are shown as mean ± SD (n = 12). The arrows shown in the figure denote a significant trend of the slope (p: p-value, β: slope). Asterisks (*) denote significant deviations from the solvent control (p < 0.05).
Acknowledgments
This image is the copyrighted work of the attributed author or publisher, and
ZFIN has permission only to display this image to its users.
Additional permissions should be obtained from the applicable author or publisher of the image.
Full text @ Chemosphere