FIGURE SUMMARY
Title

Glucosyl hesperidin exhibits more potent anxiolytic activity than hesperidin accompanied by the attenuation of noradrenaline induction in a zebrafish model

Authors
Nishida, T., Horita, C., Imagawa, M., Hibarino, M., Tateno, S., Kubo, Y., Kawabe, M., Morishita, N., Endo, S., Shiozaki, K.
Source
Full text @ Front Pharmacol

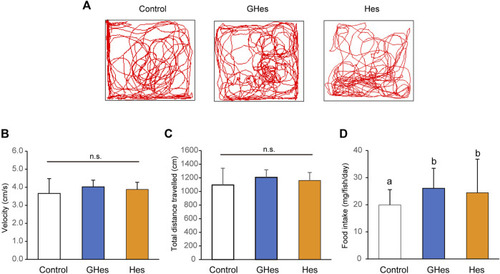
Effect of GHes and Hes on non-stress zebrafish behavior. Zebrafish were fed a control diet, GHes-diet, or Hes-diet for 52 d. (A) Tracking in a familiar tank for 5 min. (B) Swimming velocity. (C) Swimming distance. (D) Average food intake per day and fish. Results are shown as means ± standard deviation. n = 6. n.s not significant. Columns with the same letter are not statistically different, and vice versa.

Effect of GHes and Hes on zebrafish behavior in novel tank test. Zebrafish were fed control-, GHes-, or Hes-diet for 31 days and subsequently used for novel tank test, (A) Tracking of zebrafish swimming with control, GHes, or Hes-diet. (B) Freezing time during the 10 min observation. (C) Frequency of freezing. (D) Total distance traveled. n = 7. Results are shown as means ± standard deviation. n.s,. not significant. tr, trace. Columns with the same letter are not statistically different, and vice versa.

Effect of GHes and Hes on zebrafish behavior in the black-white preference test. Zebrafish were fed control, GHes, or Hes diet for 21 days and subjected to the black-white preference test. (A) Tracking zebrafish behavior. The gray and white colors in this picture indicate the black and white areas in the test tank, respectively. (B) Total swimming time in the white area. (C) Total swimming time in the black area. (D) Frequency of invasion of the white area. Results are shown as means ± standard deviation. n = 10. n.s., not significant. Columns with the same letter are not statistically different, and vice versa.

Effects of GHes and Hes on zebrafish behavior under the low water level-induced stress. Zebrafish were fed control, GHes, or Hes diet for 14 days and subjected to a low-water level stress test. (A) Zebrafish were tracked after stress induction. Upper panel: 0–5 min after stress induction. Lower panel: 5–10 min after stress induction. (B) Total Freezing time. (C) Freezing frequency. (D) Total distance traveled for 0–5 and 5–10 min. Results are shown as means ± standard deviation. n = 5. n.s., not significant. Columns with the same letter are not statistically different, and vice versa.

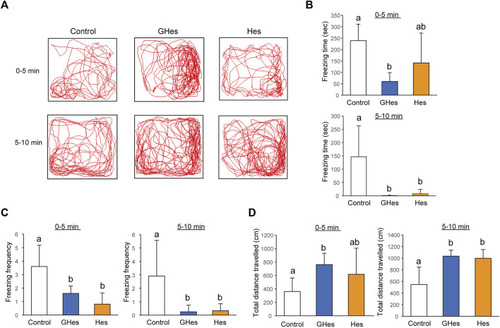
Effects of GHes and Hes on zebrafish behavior under the alarm substance-induced stress. Zebrafish were fed control, GHes, or Hes diet for 7 days and subjected to the alarm substance-induced stress test. (A) Zebrafish were tracked after stress induction. (B) Total freezing time and (C) freezing frequency. Results are shown as means ± standard deviation. n = 5. n.s., not significant. Columns with the same letter are not statistically different, and vice versa.

Alteration of the noradrenaline pathway in GHes-fed zebrafish. Control- or GHes-fed zebrafish (7 days) were exposed to alarm substance stress. (A–C) The fish brains were excised 5 min after stress, and the contents of noradrenaline (A), dopamine (B), and serotonin (C) in the brain were estimated using HPLC. (D and F) Fish brains were excised 15 min after stress. Brain lysates were subjected to Western blotting with anti-Th (D) and anti-phospho-ERK (F) antibodies. Actin and ERK were used as internal controls. Quantitative analyses of the intensities of the protein bands were conducted, and the results are presented as Th/β-actin and p-ERK/ERK. n = 8. (E) Fish brains were excised 15 min after stress induction. c-fos mRNA levels in the zebrafish brains were assessed using real-time PCR. Each level of gene expression in GHes-fed zebrafish was relative to that in control. n = 10. n.s., not significant. Results are shown as means ± standard deviation.

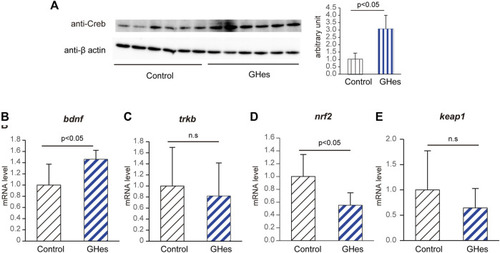
Alteration of CREB/BDNF pathway in GHes-fed zebrafish. Control- or GHes-fed zebrafish (7 days) were exposed to alarm substance stress. The brains were excised 15 min after the stress exposure. (A) Brain lysates were subjected to Western blotting with an anti-Creb antibody. β-actin was used as an internal control. Quantitative analyses of the intensities of the protein bands were conducted, and the results are presented as Creb/β-actin. n = 5. (B–E) Fish brains were excised 15 min after exposure to stress. (B)bdnf,(C) trkb, (D)nrf2, and (E)keap1 mRNA levels in zebrafish brains were assessed using real-time PCR. Each level of gene expression in GHes-fed zebrafish was relative to that in control. n = 8. n.s., not significant. Results are shown as means ± standard deviation.

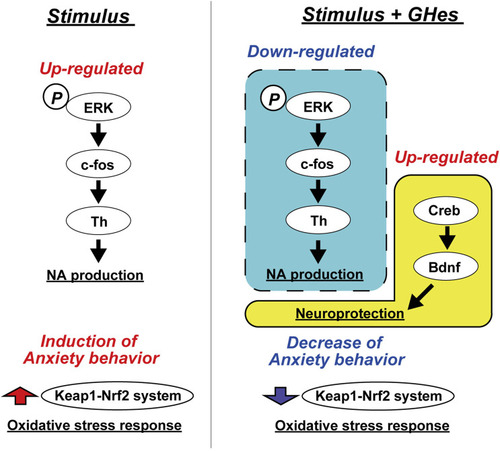
Hypothetical mechanism of the anxiolytic activity of GHes in zebrafish.

Acknowledgments
This image is the copyrighted work of the attributed author or publisher, and ZFIN has permission only to display this image to its users. Additional permissions should be obtained from the applicable author or publisher of the image. Full text @ Front Pharmacol