
- Title
-
Evaluation of developmental toxicity of safinamide in zebrafish larvae (Danio rerio)
- Authors
- Su, Z., Qin, F., Zhang, H., Huang, Z., Guan, K., Zheng, M., Dai, Z., Song, W., Li, X.
- Source
- Full text @ Ecotoxicol. Environ. Saf.

The effects of safinamide on embryonic development of zebrafish. (A) The hatching rate of zebrafish larvae,****p < 0.0001, the data represents the average of 4 independent experiments ± SEM. SC = solvent control. (B) The developmental status (death, defect, normal) of zebrafish larvae exposed to safinamide at 120 hpf. The malformation rate and mortality rate were shown in (C) and (D), ****p < 0.0001, the data represents the average of 4 independent experiments ± SEM. |

Body size of zebrafish larvae after safinamide exposure. (A) Representative images of zebrafish larvae exposed to safinamide at 120 hpf, scale bar = 500 µm. The body length (B) and distance between the eyes (C) of zebrafish larvae were measured, n = 24, *p < 0.05. |
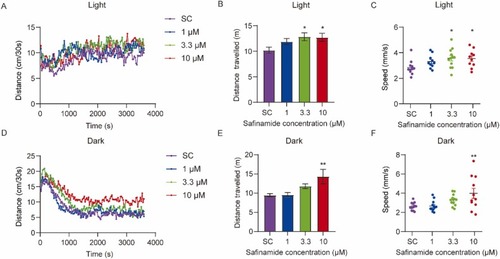
Spontaneous behaviors in zebrafish larvae after safinamide exposure. (A, D) The swimming distance (every 30 s) of zebrafish larvae exposed to safinamide were monitored under the light and dark condition at 120 hpf. The total swimming distance and speed of zebrafish larvae exposed to safinamide under the light condition (B-C) and dark condition (E-F) were calculated (each group contains 10–12 larvae), *p < 0.05, **p < 0.01. |

Locomotor activity in safinamide-exposed larvae under light/sound stimulations. (A, D) The swimming distance (every 30 s) of zebrafish larvae exposed to safinamide were monitored under the light/sound stimulations at 120 hpf. The total swimming distance and speed of zebrafish larvae exposed to safinamide under the light stimulation (B-C) and sound stimulation (E-F) were calculated (each group contains 10–12 larvae), *p < 0.05. |

Neurotransmitters mesurements in safinamide-exposed zebrafish larvae. The levels of DA (A), NE (B), 5-HT (C) and 5-HIAA (D) were measured in zebrafish larvae exposed to safinamide, the data represents the average of 4–5 independent replications. |

Transcriptional profile of safinamide-exposed zebrafish larvae. (A) The differentially expressed genes (DEGs) (the red represents significantly up-regulated genes, the green represents significantly down-regulated genes) after 10 μM safinamide exposure in zebrafish larvae at 120 hpf. (B-C) The most enriched GO and KEGG annotation classification chart. (D) Real-time PCR identified altered neuroactive ligand-receptor interaction-related genes, n = 3, *p < 0.05, **p < 0.01. |