
Image
|
Figure Caption
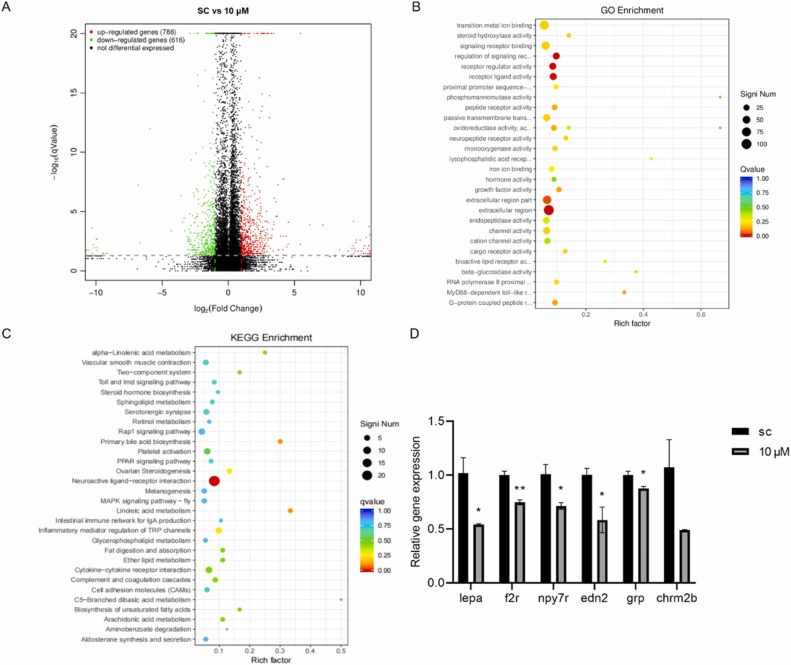
Fig. 6 Transcriptional profile of safinamide-exposed zebrafish larvae. (A) The differentially expressed genes (DEGs) (the red represents significantly up-regulated genes, the green represents significantly down-regulated genes) after 10 μM safinamide exposure in zebrafish larvae at 120 hpf. (B-C) The most enriched GO and KEGG annotation classification chart. (D) Real-time PCR identified altered neuroactive ligand-receptor interaction-related genes, n = 3, *p < 0.05, **p < 0.01.
Acknowledgments
This image is the copyrighted work of the attributed author or publisher, and
ZFIN has permission only to display this image to its users.
Additional permissions should be obtained from the applicable author or publisher of the image.
Full text @ Ecotoxicol. Environ. Saf.