
- Title
-
Microglial depletion after brain injury prolongs inflammation and impairs brain repair, adult neurogenesis and pro-regenerative signaling
- Authors
- Palsamy, K., Chen, J.Y., Skaggs, K., Qadeer, Y., Connors, M., Cutler, N., Richmond, J., Kommidi, V., Poles, A., Affrunti, D., Powell, C., Goldman, D., Parent, J.M.
- Source
- Full text @ Glia

Liposomal clodronate suppresses activated microglia after telencephalic injury. (a) Description of the lesioning method and injury location in the right telencephalon (asterisk, left panel), and an example of a dissected zebrafish brain showing the injury (yellow arrow, right panel). Tel, telencephalon. (b) Timeline of lesioning, EdU labeling and euthanasia for the 2-day time point. (c) Microglial response after injury at 1 and 2 days post lesion (dpl) as measured by tg(mpeg:GFP) reporter expression alone (green, top panels) or after double-labeling with 4C4 antibody to identify activated microglia (red, bottom panels). The midline is indicated by the dotted lines and injured regions by asterisks in the top panels. (d) Quantification of mpeg:GFP/4C4 double-positive microglia (blue line) or mpeg:GFP+/4C4− macrophages (red line) from 2 hours post lesioning (hpl) to 4 dpl. **p < .001; ***p < .0001 by repeated measures ANOVA followed by Tukey's post-hoc test. Comparisons for each curve were made between uninjured animals (the first points on the curve) and lesioned fish at each timepoint with statistical significance denoted by black asterisks, and between lesioned fish at a given timepoint versus the previous timepoint, with gray asterisks denoting significant differences. (e) 4C4 immunolabeling at 2 dpl after injection of control (top panels) or clodronate (bottom panels) liposomes. * Indicates the site of injury. (f) Quantification of 4C4+ microglia in the ipsilesional telencephalon at 1, 2, 4, and 7 dpl in control and clodronate groups. n = 12, **p < .001 by repeated measure ANOVA with Tukey's post-hoc test. (g) Quantification of 4C4 and TUNEL labeling at 2 dpl in control and clodronate groups. ***p < .0001 by t-test. Scale bar = 10 μm for (c and e); error bars indicate SEM for all graphs. |

Microglial ablation inhibits brain regeneration. (a–f) Nuclear staining with bisbenzimide in the right telencephalon at 1 (a–c) or 90 (d–f) dpl of uninjured (a, d), control lesioned (b, e) or clodronate-lesioned (c, f) fish. Asterisks in (b, c and f) denote acute (b, c) or residual (f) damage. The dotted line in each panel denotes the midline. (g) Comparisons of the proportion of brains with or without residual damage at 90 dpl in control or liposomal clodronate groups. **p = .003 by Chi-Square test. (h) Quantification of lesion size in control and clodronate groups at different time points. ***p < .0001 by repeated measures ANOVA with Tukey's post-hoc test. (i) Tg(gfap:GFP) reporter expression to assess astrocytic hypertrophy or scar-like structures at 7 and 90 dpl. Asterisks show the lesioned area/residual damage. (j) Higher magnification views of gfap-driven reporter expression in additional fish from the 90 dpl injured control and clodronate groups. Scale bars = 100 μm |
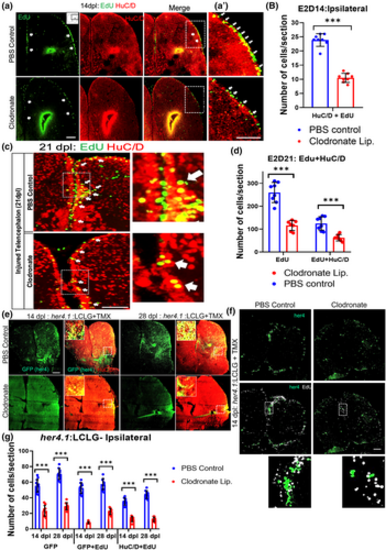
Microglial suppression impairs injury-induced adult neurogenesis. (a) Confocal images of EdU staining, HuC/D immunolabeling and double labeling for EdU and HuC/D in the injured hemi-telencephala at 14 dpl after EdU administration at 2 dpl from control (top row) and clodronate injected (bottom row) brains. The arrows denote EdU+ cells in VZ regions. (a′) Higher magnification images of the boxed regions in (a). Note more double-labeled cells (arrows) are present in the control than the clodronate-treated fish (bottom). The strong signal at the injury site is non-specific labeling of damaged brain. (b) Quantification of EdU and HuC/D double labeling at 14 dpl. ***p < .0001 by t-test. (c) Confocal images of EdU and HuC/D double labeling in telencephala at 21 dpl (EdU was given at 2 dpl). Right panels show higher magnification views of the boxed regions, and the arrows indicate double labeled cells. (d) Quantification of EdU+ cells (green) and cells co-labeled for EdU and HuC/D (magenta outline) in injured hemi-telencephala at 21 dpl (EdU was given at 2 dpl) shows proportionally fewer cells in the clodronate-treated group. **p < .001 for EdU only; and ***p < .0001 for double-labeled cells. (e) Confocal images of her4.1(GFP) and HuC/D labeling of telencephala at 14 dpl (left 4 panels) or 28 dpl (right 4 panels) from fish treated with control (top row) or clodronate (bottom row) liposomes show decreased GFP labeling and double-labeled cells in the clodronate group. Insets in double-labeled panels show higher magnification views of the boxed areas. (f) Confocal images of telencephala show decreased labeling for her4.1-GFP and EdU in the clodronate-treated fish at 14 dpl. The bottom panels shows a higher magnification views of double-labeled cells. 4-OH-TMX was given at the time of lesioning for both (f and g), and EdU was administered at 2 dpl. (g) Quantification of her4.1-GFP, her4.1-GFP/EdU co-labeling and her4.1-GFP/HuC/D co-labeling at 14 and 28 dpl. ***p < .0001. Scale bars = 100 μm for all image panels and the error bars indicate SEM. |

Microglia are dispensable for adult neural stem cell proliferation. (a) EdU labeling of the ipsilesional telencephalon of control or clodronate injected brains at 2 dpl. The dashed circle marks the injury site. The strong green stain at the poke site is non-specific labeling of injured tissue. (b) EdU quantification in the ipsilesional telencephala at 1, 2, 4, and 7 dpl. n = 8/group/timepoint, ***p < .0001; **p < .001; *p < .01, repeated measures ANOVA with Tukey's post-hoc test. (c) Confocal images of Glutamine synthetase (GS) and EdU co-immunolabeling at 2 dpl showing anterior (top row) and more posterior (bottom row) telencephalic regions. The small cartoon insets show the image location in the telencephalon. (d) Quantification of double labeling for GS and EdU in both ipsilesional and contralateral telencephalic hemispheres. (e) Confocal images of gfap-driven GFP reporter and EdU co-labeling of midline telencephala at 2 dpl from clodronate and control liposome-treated fish. Arrows indicate double labeled cells. (e′) Orthogonal views of single optical sections from z-stacks of GFP and EdU labeling for colocalization. (f) Quantification of ipsilesional Gfap/EdU co-labeled cells at 2, 4, and 7 dpl at the ventricular zone revealed no significant differences between groups. (g) Quantification of VZ gfap-driven GFP reporter/TUNEL double-positive cells at 2 dpl showed no significant difference between groups. (h) GFP-labeled images of telencephala from a 1016tuba1a-GFP reporter line at 2 dpl after injection of control or clodronate liposomes. Note the marked reduction of GFP in the clodronate-treated fish. The boxed areas are shown at higher magnification in the right panels. (i) Quantification of relative corrected total cell fluorescence (CTCF) intensity of 1016tuba1a-GFP reporter expression. ***p < .0001. Scale bars = 100 μm in all image panels, and the error bars indicate SEM. |

Microglial ablation impairs injury-induced amplifying intermediate progenitor cell (aIPC) expansion. (a) Confocal images of midline telencephalic sections from clodronate and control liposome injected fish double labeled for a gfap-driven GFP reporter (green) and EdU (white) at 2 dpl. The dashed red lines divide the VZ + SVZ (left of the lines) from the parenchyma (P). (b) Quantification of gfap-driven GFP reporter-negative/EdU-positive cells at 2 dpl in the VZ plus SVZ. **p < .001 by t-test. (c) Confocal images of double labeling for Sox2 (green) and EdU (red) at 2 dpl in the VZ + SVZ at the midline telencephalon. Arrows indicate double-positive cells, and the boxed areas are shown at higher magnification below. (c′) Orthogonal views of single optical sections from z-stack images of Sox2 and EdU labeling. (d) Quantification of percentages of Sox2+ cells that co-labeled with EdU in the ipsilesional telencephalon at 2 and 4 dpl. **p < .001 by t-test. (e) Sox2 immunolabeling of lesioned control liposome and clodronate liposome treated fish telencephala at 2 dpl. Arrows indicate labeled progenitor cells in the VZ/SVZ and asterisks denote the damaged regions. (f) Quantification of Sox2-labeled cells in control and clodronate injured brains at 2 and 4 dpl. *p < .01 by t-test. (g) Quantification of Sox2/TUNEL co-labeled cells at 2 dpl in control and clodronate groups. (h) Quantification of L-Plastin and EdU double-labeled cells at 2, 4, and 7 dpl in control and clodronate injected groups revealed significantly increased double-labeled cell numbers in the clodronate group at 4 and 7 dpl. **p < .001; *p < .01. Scale bar = 100 μm for all image panels except 50 μm for the higher magnification images in panel (c); error bars indicate SEM. |

Reduced injury-induced proliferation after genetic depletion of microglia, and persistent macrophages after clodronate suppression of microglia. (a) Immunostaining for 4C4 (microglia, red) and EdU (proliferating cells, green) in irf8+/− versus irf8−/− fish telencephala with or without injury at 2 dpl. (b) Quantification of microglia and EdU-positive cells in irf8 mutants and controls without injury or at 2 dpl. (c) Staining for 4C4 (red) and EdU (green) in csf1rDM mutant (left panels) and wildtype (right panels) brains with or without injury. Dashed lines indicate the midline in (a and c). (d) Quantification of microglia in csf1rDM and wildtype brains. (e) EdU-positive cell quantification in csf1rDM and wildtype brains. (f) Quantification of cells double-labeled for Gfap/EdU or Sox2/EdU in mutant fish (irf8−/− and csf1rDM lines) and fish treated with PLX3397 compared to control lines (irf8+/−, DMSO and wildtype) at 2 dpl. (g) Double immunolabeling of telencephala for mCherry to label mpeg1-positive cells (red) from mpeg1:mcherry reporter fish and 4C4 (green) for microglia in control and clodronate injected fish. The images are ipsilesional, and the dotted boxes are shown at higher magnification on the right. (h) Quantification of microglia (mpeg+, 4C4+) and macrophages (mpeg+, 4C4−) in control and clodronate brains at 2 dpl. ***p < .0001 for all graphs. Scale bars = 100 μm for all image panels, and the error bars indicate SEM. |

Microglial ablation after brain injury attenuates pro-regenerative signaling. (a) qRT-PCR showing relative mRNA levels of different inflammatory cytokines or regenerative signaling molecules. Two pooled hemi-telencephala (injured side) per condition (clodronate-treated vs. control lesioned) were used, and the Y axis is log fold change. (b–e) Post-injury qRT-PCR timecourse analysis of gene expression for stat3 (b), ascl1a (C) c-myc (d) or gata3 (e) in injured hemi-telencephala from fish receiving control or clodronate liposomes, or in irf8+/− (control), irf8−/− and csf1rDM mutant brains. (f) GFP labeling of telencephala from a pStat3 signaling reporter line at 2 dpl after control or clodronate liposome injections. The boxed areas in the left panels are shown at higher magnification at right. (g) Quantification of corrected GFP fluorescence intensity of right (injured) telencephala from tg(gfap:GFP), tg(stat3-GFP), tg(ascl1a:GFP), and tg(tcf7miniP:dGFP) reporter fish at 2 dpl after clodronate injury compared to controls. (h) EdU labeling of control and clodronate injected brains at 2 dpl with or without heat shock (HS) to induce stat3 and ß-catenin transgene expression. (i) Quantification of EdU+ cells at 2 dpl after ectopic activation of stat3, ascl1a, ß-catenin, and stat3 + ß-catenin with or without HS treatment in control and clodronate injured fish. The schematic above shows the experimental design. (j) Quantification of cells double-labeled for Gfap/EdU or Sox2/EdU in brains from the double transgenic stat3 and constitutively active-beta-catenin (ca-bcatenin) overexpression fish with control and clodronate injury, and with and without heat shock (HS). NS, not significant; ***p < .0001; **p < .001; *p < .01 by ANOVA with Tukey's post-hoc test in (c, g, i, and j). Scale bars = 100 μm for image panels, and error bars indicate SD. |

Persistence of neutrophils when microglia are ablated in the setting of brain injury. (a) Quantification of microglia (4C4) and leukocytes (L-Plastin) in the ipsilesional hemi-telencephala of control or clodronate liposome injected fish at 2 dpl. (b) Confocal images of fish telencephala from PBS control and clodronate treated groups at 1–4 dpl, and irf8+/− (control), irf8−/− and csf1rDM groups at 2 dpl, all immunolabeled for an Mpx-mcherry reporter (neutrophils). (c–e) Quantification of Mpx reporter-positive neutrophils from control, clodronate treated, irf8 and csf1rDM mutant brains. (f) Proposed model of the microglia-induced signaling pathway during injury-induced telencephalic regeneration in zebrafish. ***p < .0001; **p < .001; *p < .01 by t-test for panels (a, c, d, and e). Scale bars = 100 μm, and the error bars indicate SD. |