
|
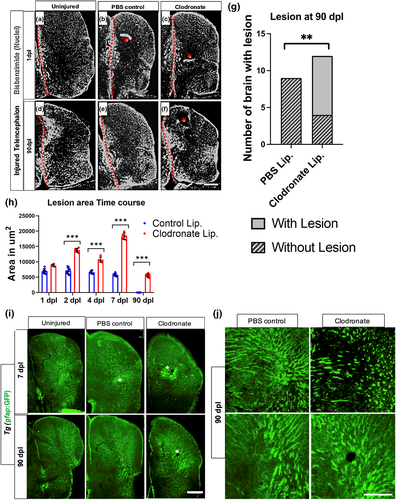
Fig. 2 Microglial ablation inhibits brain regeneration. (a–f) Nuclear staining with bisbenzimide in the right telencephalon at 1 (a–c) or 90 (d–f) dpl of uninjured (a, d), control lesioned (b, e) or clodronate-lesioned (c, f) fish. Asterisks in (b, c and f) denote acute (b, c) or residual (f) damage. The dotted line in each panel denotes the midline. (g) Comparisons of the proportion of brains with or without residual damage at 90 dpl in control or liposomal clodronate groups. **p = .003 by Chi-Square test. (h) Quantification of lesion size in control and clodronate groups at different time points. ***p < .0001 by repeated measures ANOVA with Tukey's post-hoc test. (i) Tg(gfap:GFP) reporter expression to assess astrocytic hypertrophy or scar-like structures at 7 and 90 dpl. Asterisks show the lesioned area/residual damage. (j) Higher magnification views of gfap-driven reporter expression in additional fish from the 90 dpl injured control and clodronate groups. Scale bars = 100 μm