
- Title
-
Plexina4 and cell survival in the developing zebrafish hindbrain
- Authors
- Nurcombe, Z.W., Hehr, C.L., McFarlane, S.
- Source
- Full text @ Dev. Dyn.

Expression of plxna4 mRNA by hindbrain cells. ISH for plxna4 in lateral whole mount (A, B, D, G) and in transverse sections (C, E, F, H, I, K), along with JL8 immunolabel for GFP in whole mount (J) and section (K′) of Tg(islet:eGFP) fish. (A) At 18 ss, plxna4 is expressed in the forebrain and spinal cord. (B) plxna4 expression at 24 hpf. Otic vesicle (arrowhead). (C) Transverse hindbrain section shows two lateral domains of plxna4 expression (arrows), a broad dorsal domain (arrowhead), as well as expression by cells adjacent to the floorplate. Approximate location of section is shown by line (C) in B. (D, G) plxna4 expression at 36 hpf (D) and 48 hpf (G). (E, F, H, I) plxna4 mRNA in bilateral cell populations (arrowheads) at 36 hpf (E, F) and 48 hpf (H, I). plxna4-expressing cells also abut the floorplate (arrows). Approximate location of sections are shown by lines in D (for E and F) and G (for H and I). Inset in I shows Islet immunolabeling in a comparable hindbrain section. (J) plxna4 mRNA in the hindbrain and in some Islet1-expressing (teal) cranial motoneurons (arrowheads) at 24 hpf. (K) plxna4 expression (K) and JL8 immunolabeling for GFP (K′) in a 48 hpf hindbrain section. Dotted line marks the pial surface and arrows point to co-expressing cells. a: anterior, br: brain, d: dorsal, floor plate: fp, fb: forebrain, hb: hindbrain, mb: midbrain, ov: otic vesicle; p: posterior, v: ventral, ve: ventricle. Scale bar: 300 μm (A), 250 μm (B, D, G), 200 μm (J), 50 μm (C, E, F, H, I), 25 μm (K, K′). |

Generation of a CRISPR plxna4 mutant allele: (A) Top: The target nucleotide sequence of exon 1 of plxna4 shows a six base pair (bp) deletion and 27 bp insertion in plxna4ca307 as compared with WT. The alterations in the gene disrupt the WT triplet codon usage and introduce a premature stop (boxed in red). Bottom: The predicted mutant protein is truncated to 143 aa. (B) Fold difference of plxna4 mRNA levels between WT and plxna4ca307 fish as determined by RT-qPCR, with WT data represented as 1. Unpaired Student's t-test performed between the delta CT values for WT and plxna4ca307 fish. N = 3 independent replicates. Error bars are SD. (C–F) plxna4+/+ (C, E) and plxna4ca307 (D, F) embryos at 24 hpf (C, D) and 48 hpf (E, F). Numbers represent combined embryos from two independent clutches. Scale bar: 200 μm (C), 300 μm (E, F). |

Development of the hindbrain apparently normal in the absence of Plxna4: Whole mount ISH for hindbrain markers in lateral (A, B, E–H) and dorsal (C, D) views of WT (A, C, E, G) and plxna4 mutant (B, D, F, H) embryos at 22 hpf (A, B) and at 24 hpf (C–H). (A, B) fgf8a marks the midbrain-hindbrain border. (C, D) The transcription factor pax6a. (E, F) sema3fa labels the dorsal midbrain and rhombomere 1 of the hindbrain. (G, H) foxg1a labels the hindbrain and the cranial ganglia. Numbers indicate the number of embryos that exhibit the displayed expression pattern. A: anterior, cg: cranial ganglia, e: eye, fb: forebrain, hb: hindbrain, mb: midbrain, mhb: midbrain-hindbrain boundary, P: posterior, r1: rhombomere 1. Scale bar in A is 250 μm (A, B, E, F), 150 μm (C, D), 300 μm (G, H). |
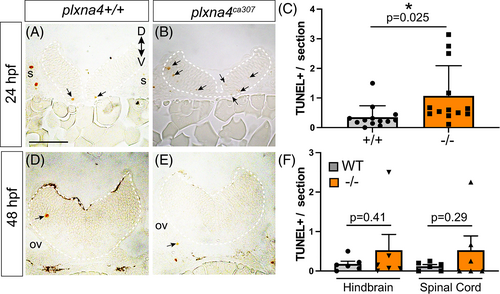
Apoptotic cell death in the plxna4ca307 hindbrain. (A–D) Representative hindbrain sections show TUNEL+ dying cells (arrows) in 24 (A, B) and 48 (D, E) hpf WT and mutant embryos. (C, F) Blinded quantitation of average number of TUNEL+ cells/section in the hindbrain of WT and plxna4ca307 embryos at 24 hpf (N = 5; WT n = 13; −/− n = 13; unpaired Student's t-test, P = 0.0251) and 48 hpf hindbrain and spinal cord (N = 2; WT n = 6, plxna4ca307 n = 5, unpaired Student's t-test HB, P = 0.4061. SC, P = 0.2889. D: dorsal, ov: otic vesicle, V: ventral. Scale bar in A is 75 μm. |

Loss of Islet + cranial motor neurons in plxna4 mutants. WT and plxna4ca307 hindbrain sections immunolabeled for Islet1 at 24 hpf (A, B) and 48 hpf (D, E). Ventrally located motor neurons can be seen in both genotypes (arrows, dotted yellow lines). (C) Blinded quantitation of Islet1 positive cells in the transverse sections of the hindbrain of 24 hpf WT and plxna4 mutant embryos. WT N = 4, n = 9; −/− N = 4, n = 11; P = 0.3640, unpaired Student's t-test. (F) Blinded quantitation of Islet1 positive cells in the hindbrain of 48 hpf plxna4 WT and mutant embryos in the hindbrain (N = 3; wt n = 7; −/− n = 8; P = 0.0480, unpaired Student's t-test), anterior spinal cord when dorsally located Rohon–Beard sensory neurons appear (N = 3, WT n = 7; −/− n = 7; P = 0.1197 Unpaired Student's t-test), and the spinal cord (N = 3; WT n = 7; −/− n = 5; P = 0.4526, unpaired Student's t-test). D: dorsal, ov: otic vesicle, V: ventral. Scale bar in A is 50 μm. |

clu expressed in but not required for the formation of the floorplate. (A–D) In whole mount (A, C) and transverse sections (B, D) of 24 hpf (A, B) and 48 hpf (C, D) embryos, clu is expressed in the floorplate (arrows). At 48 hpf, clu mRNA is also present in the choroid plexus. (E, F) At 24 hpf (E) and 48 hpf (F) plxna4 (green) and clu (blue) mRNAs are expressed in cells adjacent to one another in the hindbrain, as evident in the overlay of comparable sections. (G–J) Uninjected control (G, I) and clu ATG morphant (H, J) embryos (N = 1, UIC n = 5, morphant n = 7) (G, H). Expression of foxa2, a marker of the floorplate, in whole mount at 24 hpf (N = 2, UIC n = 12, morphant n = 11) (I, J) and in transverse section at 48 hpf (K, L). A: anterior; cp: choroid plexus, D: dorsal, e: eye, fp: floorplate, hb: hindbrain, P: posterior, sc: spinal cord, V: ventral. Orientation in A for A, C, G–J and in B for B, D–F, K, L. Scale bar: 300 μm (A, C), 400 μm (G, H), 75 μm (B, D–F, K, L). |

Clu acts independently of Plxna4 to promote hindbrain cell survival. (A, B, E, F) Hindbrain sections of 24 hpf WT (A), clu ATG-morpholino-injected WT (B), plxna4 mutant (E), and clu ATG-morpholino-injected mutant (F) embryos. Arrows point to TUNEL+ cells. (C) RT-PCR of cDNA generated from mRNA isolated from 24 hpf control embryos and embryos injected at the 1-cell stage with an e3i3 antisense morpholino targeting the exon 3-intron 3 splice junction in the clu pre-mRNA. Endogenous mRNA is downregulated and is slightly larger in size in the e3i3 morphants than control embryos. PCR band for ef1a was similar between control embryos and e3i3 morphants. (D) Graph shows numbers of activated caspase-3 immunolabeled cells counted in sections (n = 5-11 sections/embryo) of the 24 hpf hindbrain of embryos injected at the 1-cell stage with 2 to 3 ng of either the clu e3i3 MO or an e2i2 MO targeting the bhlhe40 gene; control (n = 8), bhlhe40 e2i2 MO (n = 7) and clu e3i3 MO (n = 8); N = 2 independent replicates. Error bars are SD and dots represent individual embryos. One-way ANOVA, Kruskal–Wallis non-parametric post-hoc test. (E) Blinded quantitation of TUNEL+ cells in each condition. MO, morpholino oligonucleotide; UIC, uninjected control. All N = 3, n = 9 except −/− clu MO N = 3, n = 13. One Way ANOVA, Kruskal–Wallis test. Scale bar in A is 75 μm. |