
- Title
-
Developmental and behavioral toxicity assessment of opicapone in zebrafish embryos
- Authors
- Su, Z., Guan, K., Liu, Y., Zhang, H., Huang, Z., Zheng, M., Zhu, Y., Zhang, H., Song, W., Li, X.
- Source
- Full text @ Ecotoxicol. Environ. Saf.

Fig. 1. Gross morphological statistics of zebrafish larvae exposed to opicapone. (A) Zebrafish were exposed to opicapone from 6 hpf to 120 hpf. (B) Mortality rates of zebrafish exposed to 1 μΜ, 3.3 μΜ, 10 μΜ, 30 μΜ, 100 μΜ, 200 μΜ was calculated. (C) The 30 μΜ opicapone treatment notably inhibited the development of zebrafish larvae, causing significantly delayed hatching. N = 4, * * p < 0.01, * ** * p < 0.0001. (D) Statistics on the developmental status (death, defect, normal) of larval zebrafish exposed to different concentrations of opicapone at 120 hpf, the malformation rate (E) and mortality rate (F) were calculated. N = 4, * ** * p < 0.0001. |
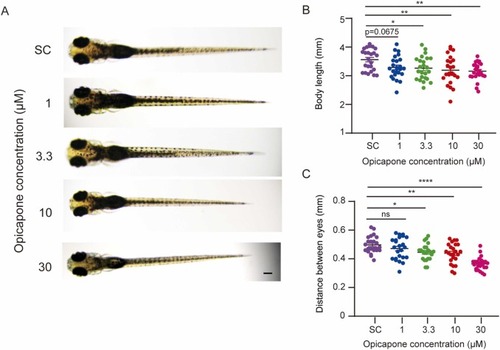
Fig. 2. Opicapone exposure caused short body size and small head in zebrafish larvae. (A) Representative pictures of larval zebrafish exposure to different concentrations of opicapone at 120 hpf. The body length (B) and distance between eyes (C) of zebrafish larvae were measured, scale bar = 250 µm. N = 24, * p < 0.05, * * p < 0.01,* ** * p < 0.0001. |

Fig. 3. Opicapone exposure caused decreased spontaneous behaviors in zebrafish larvae. (A) The 1 μΜ and 10 μΜ opicapone-treated larvae showed decreased swimming distance under the light condition. The corresponding average speed of each larva was measured in (B). (C) The 10 μΜ opicapone-treated larvae showed decreased swimming distance under the dark condition. The corresponding average speed of each larva was measured in (D). * ** p < 0.001. (E, G) Swimming distance of zebrafish larvae exposed to opicapone under the light/sound stimulation condition. The corresponding average speed of each larva was measured in (F, H). Opicapone-treated larvae did not show notably change in locomotor activity after light/sound stimulation. N = 12, * p < 0.05,. |

Fig. 4. Monoamine neurotransmitter levels measured by HPLC after opicapone treatment. (A-C) The levels of 5-HT, 5-HIAA and NE showed no significant difference compared with the control group. (D) The level of DA increased significantly after 10 μΜ opicapone exposure. N = 5, * * p < 0.01. |
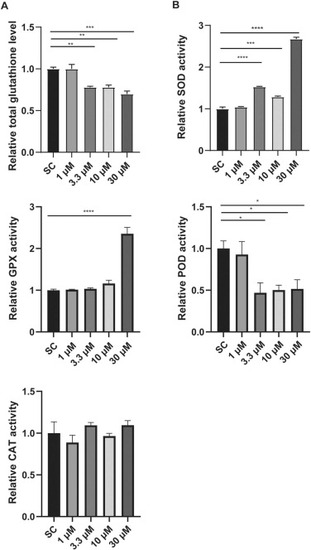
Fig. 5. Opicapone exposure caused reduced total glutathione levels and changed antioxidant enzymes activities. (A) Relative total glutathione level of zebrafish larvae was significantly reduced after opicapone exposure. (B-E) Relative SOD and GPX, activities were increased notably in zebrafish larvae while POD activity decreased, and no significant change was found in CAT activity. * p < 0.05 * * p < 0.01, * ** p < 0.001, * ** * p < 0.0001. |

Fig. 6. Analyses of transcriptome sequencing after 30 μM opicapone exposure. (A) The differentially expressed genes after 30 μM opicappone exposure in zebrafish larvae (The red represents significantly up-regulated genes, while the green represents significantly down-regulated genes). (B-C) The thirty most enriched KEGG and BP annotation classification chart. Results of real-time PCR showed that glutathione metabolism related genes (gstm.3, gstp1, gstp2, mgst1.2, mgst3b, odc1, pgd, srm) (D) and cytokine-cytokine receptor interaction related genes (ccl20a.3, ccl25b, ccr6b, cxcr3.2, faslg, il11ra, nradd) (E) were up-regulated. N = 3, * p < 0.05, * * p < 0.01, * **p < 0.001, * ** * p < 0.0001. |