
|
Fig. 6
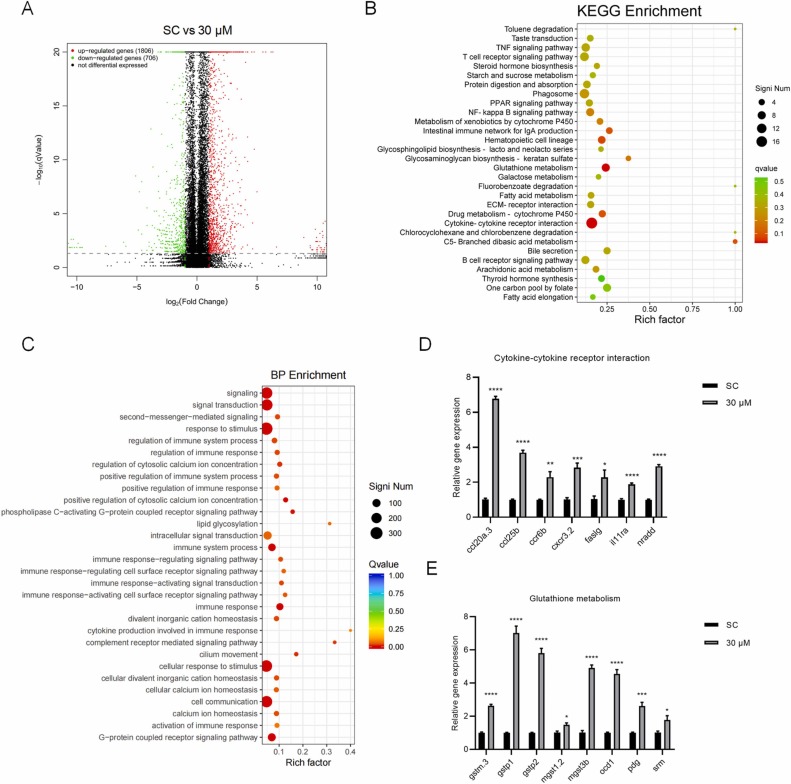
Fig. 6. Analyses of transcriptome sequencing after 30 μM opicapone exposure. (A) The differentially expressed genes after 30 μM opicappone exposure in zebrafish larvae (The red represents significantly up-regulated genes, while the green represents significantly down-regulated genes). (B-C) The thirty most enriched KEGG and BP annotation classification chart. Results of real-time PCR showed that glutathione metabolism related genes (gstm.3, gstp1, gstp2, mgst1.2, mgst3b, odc1, pgd, srm) (D) and cytokine-cytokine receptor interaction related genes (ccl20a.3, ccl25b, ccr6b, cxcr3.2, faslg, il11ra, nradd) (E) were up-regulated. N = 3, * p < 0.05, * * p < 0.01, * **p < 0.001, * ** * p < 0.0001.