
- Title
-
Dhx38 regulates the maintenance and differentiation of erythro-myeloid progenitors and hematopoietic stem cells by alternative splicing
- Authors
- Tu, J., Yu, S., Li, J., Ren, M., Zhang, Y., Luo, J., Sun, K., Lv, Y., Han, Y., Huang, Y., Ren, X., Jiang, T., Tang, Z., Williams, M.T.S., Lu, Q., Liu, M.
- Source
- Full text @ Development

Knockout of dhx38 in zebrafish impaired EMP differentiation. (A) In vivo imaging of the expression of the CMV promoter vector and dhx38 promoter vector in wild-type embryos. Scale bars: 200 μm. The dhx38 promotor mainly drives mCherry expression in the PBI region (indicated by white arrows). (B) Representative images of dhx38 expression in Tg(cmyb:eGFP) embryos at 36 hpf. White arrows indicate the co-expression of dhx38 and cmyb. Scale bars: 50 μm. (C) A schematic diagram of the dhx38 gRNA locus. (D) DNA sequencing identified a 10 bp deletion of cDNA (c.11_21delTTCCTCCCTG), which predicts a truncated protein (p.Ser5_ThrfsTer7). (E) qRT-PCR shows a significant decrease of dhx38 mRNA in the dhx38 mutants. (F,G) WISH results show that the expression of the EMP markers lmo2 and gata1 and the promyelocyte markers pu.1 and cebpa in the dhx38−/− embryo is increased at 33 hpf. The red line denotes increased expression. Scale bars: 200 μm. (H,I) WISH results showing that the expression of the myelocyte markers mpx, mfap4 and mpeg1, and the erythrocyte marker hbae1 is decreased in the dhx38 mutant at 33 hpf. The blue lines denote decreased expression. (J) Quantification of cell number in the PBI shown in F-I. Data show the mean±s.d. Significance was determined using a two-tailed, unpaired Student's t-test. *P<0.05, **P<0.01; ****P<0.0001. |

Maturation of EMPs is perturbed in dhx38 mutants. (A) In vivo imaging of gata1+/cmyb+ cells (EMPs) in the PBI region of Tg(cmyb:eGFP;gata1:dsred) fish. At 36 hpf and 48 hpf, the numbers of EMPs (indicated in yellow) in the dhx38−/− zebrafish are higher compared with wild-type siblings. Sibling, n=16; dhx38−/−, n=16; performed with three replicates; **P=0.002. (B) In vivo imaging of Tg(pu.1:eGFP) fish shows that promyelocytes are increased in the PBI region of dhx38 mutants at 36 hpf and 48 hpf. Sibling, n=12; dhx38−/−, n=10; performed with three replicates; ***P=0.0006. (C) In vivo imaging of macrophages in Tg(mpeg1:eGFP) also shows a decreased branched cell number in the dhx38 mutant at 48 hpf. Sibling, n=11; dhx38−/−, n=11; performed with three replicates; ****P=0.00003. (D) In vivo imaging of granulocytes in Tg(mpx:eGFP) displays a decreased number in the dhx38 mutant at 48 hpf. Sibling, n=12; dhx38−/−, n=11; performed with three replicates; ***P=0.00013. (E) Sudan Black staining in dhx38−/− zebrafish shows that mature granulocytes are decreased at 48 hpf. Black arrows indicate granulocytes. Sibling, n=34; dhx38−/−, n=23; performed with three replicates; ****P=0.000001. (F) Neutral Red staining shows significantly decreased numbers of functional macrophages. Black arrows indicate macrophages. Sibling, n=14; dhx38−/−, n=11; performed with three replicates; ***P=0.00014. (G-L) Quantification of cells from A-G. Significance was determined using a two-tailed, unpaired Student's t-test. **P<0.01; ***P<0.001; ****P<0.0001. All scale bars: 50 μm. |

Loss of dhx38 impairs definitive hematopoiesis. (A) In vivo imaging of hematopoietic progenitor cells in Tg(cmyb:eGFP;flk:mCherry) at 36 hpf, 48 hpf and 56 hpf. The double-positive fluorescence (white arrows) in the VDA region shows that hemogenic endothelium emerges normally in the dhx38 mutants. However, the number of cmyb+ cells in the dhx38 mutants are increased at 48 hpf, but decreased at 56 hpf. White dotted lines represent the caudal artery. For 36 hpf: sibling, n=13; dhx38−/−, n=13; P=0.51, not significant. For 48 hpf: sibling, n=14; dhx38−/−, n=19; *P=0.016. For 56 hpf: sibling, n=19; dhx38−/−, n=15; ****P=0.000023. Quantification of cells from 36 hpf, 48 hpf, and 56 hpf is shown on the right. (B) Immunostaining of Tg(cmyb:eGFP;gata1:dsred) fish at 48 hpf shows an increase in the number of cmyb+/gata1+ cells (EMPs) and cmyb+/gata1− cells (HSPCs) in the CHT of dhx38 mutants. (C) Immunostaining of Tg(cmyb:eGFP;gata1:dsred) fish at 56 hpf demonstrates a decreased number of cmyb+/gata1+ EMPs and cmyb+/gata1− HSPCs in the CHT of dhx38 mutants. (D) Quantification of cmyb+/gata1+ and cmyb+/gata1− cell numbers from B. Sibling, n=11; dhx38−/−, n=11; EMPs, **P=0.0026; HSPCs, *P=0.031. (E) Quantification of cmyb+/gata1+ and cmyb+/gata1− cell number from C. Sibling, n=10; dhx38−/−, n=10; EMPs, P=0.86; HSPCs, ****P= 0.0000009. Data show the mean±s.d. Significance was determined using a two-tailed, unpaired Student's t-test. n.s., not significant; *P<0.05; **P<0.01; ****P<0.0001. All scale bars: 200 μm. |

Dhx38 deficiency induces abnormal mitosis and apoptosis of EMPs and HSPCs in zebrafish. (A) EdU assay in Tg(cmyb:eGFP) indicates an increase of cmyb+ cells in the S phase of dhx38−/− embryos at 36 hpf. White arrows indicate the colocalization of cmyb and EdU. Sibling, n=8; dhx38−/−, n=10; performed with three replicates; **P=0.001. (B) EdU assay in Tg(gata1:dsred) indicates an increase in the number of gata1+ cells in the S phase in dhx38−/− embryos at 36 hpf. White arrowheads indicate the colocalization of gata1 and EdU. Sibling, n=17; dhx38−/−, n=12; performed with three replicates; *P=0.029. (C,D) Quantification of cmyb+ EdU+ cells and gata+ EdU+ cells from A,B, respectively. (E) Double immunostaining of Tg(cmyb:eGFP) and pH3 shows that the number of cmyb+ cells in the M phase is elevated in the dhx38 mutants at 36 hpf. White arrowheads indicate the colocalization of cmyb and pH3. sibling, n=13; dhx38−/−, n=12; performed with three replicates; *P=0.028. (F) Double immunostaining of Tg(gata1:dsred) and pH3 shows that the number of gata1+ cells in the M phase is also elevated in dhx38 mutants at 36 hpf. White arrowheads indicate the colocalization of gata1 and pH3. Sibling, n=17; dhx38−/−, n=24; performed with three replicates; **P=0.0025. (G,H) Quantification of cmyb+ pH3+ cells and gata+ pH3+ cells from E,F, respectively. (I) The siDHX38-641 siRNA is at the c.641 position of the human DHX38 gene, and siDHX38-328 is at c.328. The silencing efficiency of these two siRNAs was confirmed by western blotting (left). Western blotting for DHX38 shows the efficiency of DHX38 knockdown by si-DHX38-641, but not by si-DHX38-325 (middle). Flow cytometry analysis of the cell cycle (right) after treatment with si-DHX38-641, showing a decrease of cells in the S phase and an increase of cells in the M phase. Performed with six replicates; n.s., P=0.18; **P=0.001; ***P=0.0001. (J) The protein levels of γH2AX in siblings and dhx38−/− zebrafish at 36 and 56 hpf were detected by western blotting. GAPDH was used to normalize protein loading. n=3; for 36 hpf, *P=0.01; for 48 hpf *P=0.015. (K,L) TUNEL assay in Tg(cmyb:eGFP) (bottom) and Tg(gata1:dsred) (top) shows that apoptotic cmyb+ and gata1+ cells are increased in the dhx38 mutants at 56 hpf. The double-positive fluorescence demonstrates that cmyb+ and gata1+ cells underwent apoptosis. For Tg(gata1:dsred): sibling, n=12; dhx38−/−, n=13; performed with three replicates; *P=0.019. For Tg(cmyb:eGFP): sibling, n=9; dhx38−/−, n=9; performed with three replicates; ****P=0.00006. (M,N) Quantification of double-positive fluorescent cell number from K,L. Data show the mean±s.d. Significance was determined using a two-tailed, unpaired Student's t-test. n.s., not significant; *P<0.05; **P<0.01; ***P<0.001; ****P<0.0001. All scale bars: 50 μm. |

EMPs in dhx38 mutants exhibit disordered mitosis. (A) Confocal images of immunostaining of Tg(cmyb:eGFP;gata1:dsred) fish and DAPI (white) show that an abnormal karyotype occurs in the dhx38 mutants at 48 hpf. The gray boxes indicate cells with abnormal karyotypes. (B) Quantification of cells with abnormal karyotypes. For 36 hpf, number of cells with abnormal karyotypes: sibling, 32/768; dhx38−/−, 128/820. For 48 hpf, number of cells with abnormal karyotypes: sibling, 64/736; dhx38−/−, 248/552. (C) Confocal images of immunostaining for α-tubulin and DAPI. The first three panels in the wild-type siblings show a normal karyotype and spindles during metaphase and anaphase. The last six panels in dhx38−/− show a ‘grape’ karyotype in metaphase. The ‘grape’ karyotype appears to represent chromosomes unable to align at the equatorial plate, and these cells progress to disordered anaphase in dhx38−/− embryos. Asterisks indicate abnormal karyotypes or spindles. (D) Quantification of double-positive fluorescent cell number from C. (E) Confocal images of immunostaining for cmyb (green), gata1 (red), DAPI (blue) and α-tubulin (white) at 36 hpf. EMPs (cmyb+/gata1+) undergo normal prometaphase, metaphase and anaphase in siblings, but exhibit an abnormal chromatin karyotype accompanied by a progressively abnormal spindle morphology in the dhx38 mutants. Asterisks represent abnormal mitotic processes. (F) Quantification of the percentage of EMPs in mitosis from E. Scale bars: 50 μm (A); 5 μm (C,E). ***P<0.001. |

Lack of dhx38 results in abnormal alternative splicing in the cell cycle. (A) Categories of differentially spliced genes based on the changed PSI value in the dhx38 mutants (mt). The percent spliced in index (PSI) indicates the efficiency of splicing a specific exon into the transcript population of a gene. Exons/intron that are constitutively retained in all transcripts and are never skipped have a PSI of 100. Thus, PSI UP indicates exons/introns that are more likely to be retained in the mutants and PSI DOWN indicates exons/introns that more frequently skipped in the mutants. Differential alternative splicing events, DASEs; alternative 3′ splice site, A3SS; alternative 5′ splice site, A5SS; skipped exon, SE; retained intron, RI; mutually exclusive exon, MXE. (B) Gene Ontology (GO) analysis of differentially spliced genes shows that they are significantly enriched in chromatin organization, microtubule cytoskeleton, cell cycle and DNA damage. (C) Sequence lengths and GC content around normal splicing sites and abnormal splicing sites in SE and RI events of dhx38 mutants. In SE events, the length of PSI DOWN group of 3' and 5' introns is longer than the PSI control group, but the length of PSI UP group of introns in RI events is shorter. This suggests that longer introns in SE events and shorter introns in RI events are more likely to respond to the dhx38 loss of function. The PSI DOWN group of GC content around the exon in differential SE events is lower in the dhx38 mutants. This demonstrates that exons with lower GC content are more likely skipped when dhx38 is knocked out. n.s., not significant; *P<0.05; ***P<0.001; ****P<0.0001. (D) Heat maps of differentially spliced genes enriched in chromosome segregation, microtubule cytoskeleton, cell cycle kinase and DNA damage. |

dhx38 modulates the alternative splicing of a subset of genes involved in mitosis and DNA damage. (A) Semi-qPCR confirms the abnormal splicing of the genes shown in Fig. 6D. The left band represents gene splicing in the wild-type siblings, whereas the right band represents splicing in the dhx38 mutants. Percent spliced in, PSI; skipped exon, SE; retained intron, RI; exon, E; intron, I; premature termination codon, PTC. Black underlines denote abnormally spliced exons/introns. Experiments were performed with three replicates; gapdh was used as the internal control. (B) qRT-PCR analysis confirming mRNA expression of differentially spliced genes shown in Fig. 6D. n≥12 per group, performed with three replicates; gapdh was used as the internal control. Data show the mean±s.d. Significance was determined using two-tailed unpaired Student's t-test; *P<0.05; **P<0.01; ***P<0.001. (C) The genes shown here are those with splicing abnormalities and downregulated expression, which were by semi-qPCR and qRT-PCR, respectively. Of the genes assessed, cenpk, smc5, knl1, kdm8, eme1, tonsl, ccng2, ccnb2 and aaas are predicted to undergo PTC-NMD events, whereas trip12, scrib, pard3ab, sept6, ift20 and lzts2a undergo differential isoform transition, with mis18a, dtl, rad9a, mak and cep131 generating disordered isoforms. (D) Western blotting for CCNB2 in the si-DHX38-641 displays decreased protein expression compared with the si-NC or si-DHX38-325 group. n=3, *P=0.041. |
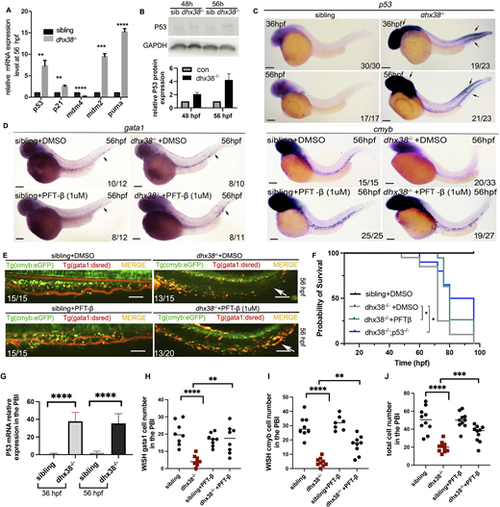
EMPs and HSPCs in the dhx38 mutants undergo P53-dependent apoptosis. (A) qRT-PCR analysis of the genes involved in P53 signaling shows a significant increase in the expression of p53, p21, puma, mdm4 and mdm2. n≥12 per group. Experiments were performed with three replicates; gapdh was used as an internal control. (B) Western blotting analysis shows an increased expression of P53 in dhx38−/− zebrafish at 48 hpf, which increases further at 56 hpf. (C) The expression pattern of p53 detected by WISH reveals that P53 begins to accumulate in the PBI at 36 hpf and 56 hpf. Black arrows indicate the expression of p53. (D) Decreased expression of cmyb (right) and gata1 (left) in the dhx38 mutants can be rescued following incubation with the P53 inhibitor PFT-β (1 µM). Black arrows indicate the expression of gata1. (E) In vivo imaging of hematopoietic progenitor cells in Tg(cmyb:eGFP;gata1:dsred) at 56 hpf. The overall number of hematopoietic progenitor cells in the PFT-β group was higher than in the DMSO group. White arrows indicate blood cells in the CHT region. (F) The survival curve shows that PFT-β and dhx38−/−;p53−/− rescue the survival rate of dhx38 mutants. Compared with dhx38−/− embryos, the survival ratios of dhx38−/− embryos incubated with PFT-β at 72 hpf (**P=0.003) and 76 hpf (*P=0.079) are significant. Compared with dhx38−/− embryos, the survival ratios of dhx38−/−;p53−/− at 72 hpf (*P=0.012), 76 hpf (*P=0.029) and 80 hpf (**P=0.007) are significant. n≥20 per group. Experiments were performed with three replicates; (G-J) Quantification of cells from C-E. Data show the mean±s.d. Significance was determined with two-tailed unpaired Student's t-test. *P<0.05; **P<0.01; ***P<0.001; ****P<0.0001. All scale bars: 200 μm. |