FIGURE SUMMARY
Title

Abnormal male reproduction and embryonic development induced by downregulation of a phospholipid fatty acid-introducing enzyme Lpgat1 in zebrafish

Authors
Shibata, T., Kawana, H., Nishino, Y., Ito, Y., Sato, H., Onishi, H., Kano, K., Inoue, A., Taketomi, Y., Murakami, M., Kofuji, S., Nishina, H., Miyazawa, A., Kono, N., Aoki, J.
Source
Full text @ Sci. Rep.

ZFIN is incorporating published figure images and captions as part of an ongoing project. Figures from some publications have not yet been curated, or are not available for display because of copyright restrictions.

EXPRESSION / LABELING:
Gene:
Fish:
Anatomical Term:
Stage: Adult

Generation of lpgat1 mutant zebrafish by CRISPR/Cas9 system. (A) Domain structure and targeting sites for disruption of zebrafish Lpgat1 and schematic diagram of mutant Lpgat1 proteins. The active domain (motif 1) and the three acyl-acceptor binding domains (motif 2–4), which are highly conserved in AGPAT family molecules, are indicated by a pink box and blue boxes, respectively. For efficient disruption of Lpgat1 function, two sites near the functional motif were targeted. Both mutants 1 and 2 are predicted to be truncated proteins. The changed amino acid sequences are indicated by black bars. (B) Sequence alignment of the mutant alleles with predicted amino acids. Mutated nucleotide sequences and the resulted stop codons are in red. Targeting sites are in green. PAM sequences are underlined. Predicted amino acid sequences are in gray. (C) Lysophosphatidylglycerol acyltransferase (LPGAT) activities of wild-type and mutant Lpgat1 proteins. The LPGAT assay was performed using oleoyl lysophosphatidylglycerol (C18:1 LPG), palmitoyl-CoA (C16:0-CoA) and the microsomal fraction from HEK293A cells expressing wild-type or mutant Lpgat1 proteins. Relative LPGAT activities (activity of the microsomal fraction from vector-transfected cells = 1) are shown. The data represents the mean ± S.D. of triplicate measurements. Statistically significant differences are marked with asterisk. **p < 0.01. Two-way ANOVA, Holm’s multiple comparison test was used.

lpgat1+/ male zebrafish exhibited a reproductive defect. (A) Representative images of abnormal eggs resulting from crossing between lpgat1+/ male and wild-type female. The abnormal eggs showed no signs of cell division and, over time, became coagulated. The results from mutant 1 are shown. The elapsed time after mating is indicated at the top of the panels. Zen Pro software (Zeiss) was used to process the images. Scale bar, 500 µm. (B) Percentage of eggs with no sign of cell division at 6 hpf. Results from the crossing between the indicated genotypes are shown. For mutants 1 and 2, four genotype combinations of crosses (lpgat1+/+ males/lpgat1+/+ females, lpgat1+/ males/lpgat1+/+ females, lpgat1+/+ males/lpgat1+/ females and lpgat1+/ males/lpgat1+/ females) were performed for four times each and the results of the same genotype combination were combined. The numbers of eggs analyzed are indicated on the top of each bar. Error bars are S.D. Statistically significant differences are marked with asterisk. *p < 0.05; **p < 0.01, ***p < 0.001. Two-way ANOVA, Holm’s multiple comparison test was used. (C) Percentage of coagulated eggs overtime after mating. Results from the crossing between the indicated genotypes are shown. Crossing were performed for four times each. Representative data using mutant 1 are shown. Eighty eggs were buried in an agarose gel and evaluated based on the images by time-lapse observation. The result from ovules (unfertilized eggs) is also shown. (D) Representative images of ovules (unfertilized eggs) squeezed out of a wild-type female over time. Note that they showed no signs of cell division and, over time, became coagulated as in (A, lower). The elapsed time after the eggs were squeezed out is indicated at the top of the panel. Scale bar, 500 µm.

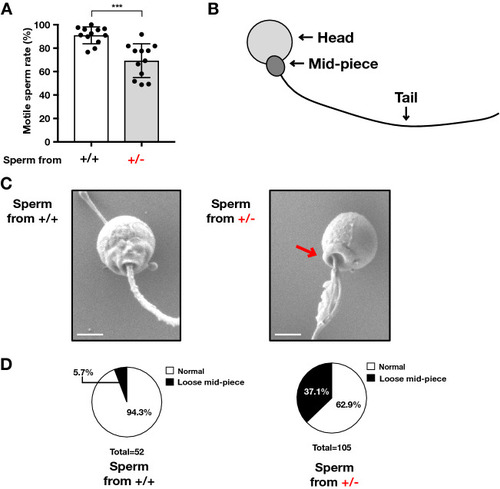
lpgat1 heterozygotes produce some sperm with less motility and abnormal morphology. (A) Percentage of sperm with motility from lpgat1+/+ and lpgat1+/. Semen was collected from anesthetized zebrafish by abdominal compression. Sperm motility was measured by Computer Assisted Semen Analysis, CASA. Each point represents the results of different individual zebrafish (n = 12 for both lpgat1+/+ and lpgat1+/, The data were combined from mutant 1 (n = 7) and 2 (n = 5)). Error bars are S.D. Statistically significant differences are marked with asterisks. *p < 0.05; **p < 0.01. Unpaired, two-tailed t-test was used. (B) Schematic diagram of zebrafish sperm. Zebrafish sperm consists of a head, a mid-piece, and a tail. Unlike sperm from mammals, sperm from zebrafish have no acrosome. The head contains the nucleus, and the midpiece is enriched in mitochondria. (C) SEM analyses of sperm from lpgat1+/+ and lpgat1+/ zebrafish. Representative images from mutant 1 were shown. Note that sperm from lpgat1+/ showed abnormal morphology with loose mid-piece indicated by red arrows. Scale bar, 1 µm. (D) Percentage of sperm with abnormal morphology in SEM analyses (C). Sperm from lpgat1+/+; n = 52, from lpgat1+/ (mutant 1); n = 105.

lpgat1 homozygous mutants were not reproduced with the expected Mendelian ratio. Genotypes of offspring from crossing between heterozygotes (lpgat1+/−). The genotypes of littermate zebrafish obtained by crossing lpgat1+/− males and females were determined at each time point. Data at 7, 14, and 90 dpf were obtained from 4, 3, and 7 independent crosses, respectively. The data of mutants 1 and 2 were combined. The numbers of larvae analyzed are indicated on the top of each bar. Error bars are S.D.

Downregulation of lpgat1 induced various embryonic developmental defects using morpholino oligonucleotides (MO). Each of embryos injected with MOs were observed overtime by time-lapse imaging. (A) The representative images of the normal embryos and larva, coagulated eggs, embryos and larva with poor-growth/pigmentation defect, and malformed embryo (with bent body axis, short body length and/or edema). LAS software (Ver. 4.12, Leica) was used to process the images. hpf; hours post fertilization. Scale bar, 500 µm. (B) Upper graphs, percentage of coagulated eggs after injection of morpholino antisense oligo (MO) specific to lpgat1 (MO1) or control MO (cMO) in combination with lpgat1 mRNA. MO1 is a splicing inhibitor, which bind to the exon–intron junction of immature lpgat1 mRNA and inhibit the splicing of pre-mRNA. Middle graphs, percentage of pigmentation defect and bottom graphs, malformation in uncoagulated embryos. Basically, the same results were obtained as shown in Fig. S9B using morpholino oligonucleotides 2 (MO2). The means of the data from three independent experiments for each group with n = 200 in total are shown. Error bars are S.D. Statistically significant differences are marked with asterisk. *p < 0.05; **p < 0.01, ***p < 0.001. Two-way ANOVA, Holm’s multiple comparison test was used.

Lipidomic analyses of lpgat1 mutant zebrafish. Lipids were collected at 7 days post fertilization from a single zebrafish larva obtained from crossing an lpgat1+/− male with an lpgat1+/− female and analyzed for phosphatidylcholine (PC, A), phosphatidylethanolamine (PE, B), phosphatidylinositol (PI, C), phosphatidylserine (PS, D), phosphatidylglycerol (PG, E), and phosphatidic acid (PA, F) by LC–MS/MS. Genotypes of each larva were determined by PCR after a lipid sample was collected. The fish were obtained from three independent crosses. The numbers of samples were n = 18 for lpgat1+/+, n = 19 for lpgat1+/− and n = 7 for lpgat1−/−. Error bars are S.D. Statistically significant differences are marked with asterisks. *p < 0.05; **p < 0.01; ***p < 0.001. Two-way ANOVA, Bonferroni’s multiple comparison test was used. For molecular species with low abundance, the relative abundance of each molecular species is shown in Supplementary Fig. S9.

Phosphatidylcholine (PC) and phosphatidylethanolamine (PE) species in sperm from lpgat1+/− zebrafish. PC (A) and PE (B) species composition of zebrafish sperm was analyzed by LC–MS/MS. Semen was collected from an anesthetized zebrafish by abdominal compression. Sperm pellets were prepared from semen collected from one zebrafish and lipids were recovered. The numbers of sperm samples were n = 4 for lpgat1+/+ and n = 4 for lpgat1+/−. Error bars are S.D. Statistically significant differences are marked with asterisks. *p < 0.05; **p < 0.01; ***p < 0.001. Unpaired, two-tailed t test was used. For molecular species with low abundance, the relative abundance of each molecular species is shown in Supplementary Fig. S12.

Acknowledgments
This image is the copyrighted work of the attributed author or publisher, and ZFIN has permission only to display this image to its users. Additional permissions should be obtained from the applicable author or publisher of the image. Full text @ Sci. Rep.