FIGURE SUMMARY
Title

Blood vessel occlusion by Cryptococcus neoformans is a mechanism for haemorrhagic dissemination of infection

Authors
Gibson, J.F., Bojarczuk, A., Evans, R.J., Kamuyango, A.A., Hotham, R., Lagendijk, A.K., Hogan, B.M., Ingham, P.W., Renshaw, S.A., Johnston, S.A.
Source
Full text @ PLoS Pathog.

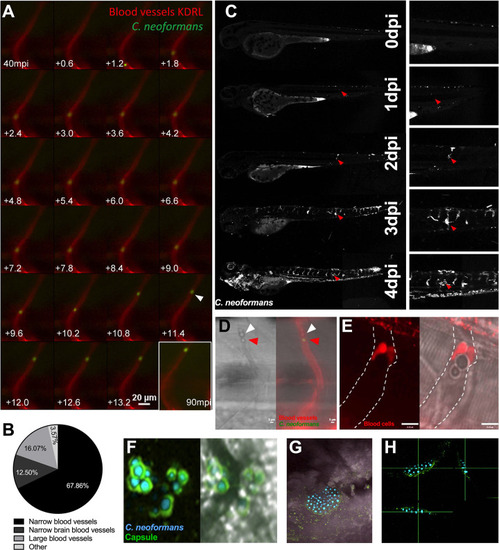
Cryptococcal mass formation by cryptococcal cell trapping in small blood vessels in the zebrafish.

A Infection of KDRL mCherry blood marker transgenic line with 25 cfu GFP C. neoformans, imaged immediately after infection. A single cryptococcal cell becomes trapped in the vasculature (white arrow), at 40 minutes post infection (mpi) after moving from the bottom of the vessel toward the top (left to right, time points +0.6 seconds). Last image shows cryptococcal cell in the same location at the end of the time-lapse at 90mpi B Infection of 2 dpf AB larvae with 25 cfu of a 5:1 ratio of GFP:mCherry KN99 C. neoformans. Larvae were imaged until 8 dpf, or death (n = 3, in each repeat 7, 10 and 12 larvae were used) Proportion of cryptococcal masss observed in small intersegmental blood vessels, small brain blood vessels, large caudal vein or in other locations e.g. yolk, (n = 3). C Infection of 2 dpf AB larvae with 25 cfu of a 5:1 ratio of GFP:mCherry KN99 C. neoformans. Larvae were imaged until 8 dpf, or death (n = 3, in each repeat 7, 10 and 12 larvae were used). In this case an mCherry majority overwhelming infection was reached. Infection progression from 0 dpi (day of infection imaged 2 hpi), until 4 dpi. Red arrows follows an individual cryptococcal mass formation and ultimate dissemination. D Infection of 2 dpf AB larvae with 25 cfu of a 5:1 ratio of GFP:mCherry KN99 C. neoformans showing blood cells (white arrow) trapped behind a cryptococcal mass (red arrow) within an inter-segmental vessel. E Infection of 2 dpf Tg(gata1:dsRed) larvae with 1000 cfu GFP of KN99 C. neoformans showing blood cells (red) trapped behind a cryptococcal mass within an inter-segmental vessel (white dashed lines). F-H GFP KN99 (cyan), antibody labelled cryptococcal capsule (green). F Cryptococci within blood vessels demonstrating the enlarged capsule blocking the vessel 24 hpi G-H Cryptococcal mass encased in capsule. G Merged florescence and transmitted light z projection H Three-dimensional section of cryptococcal mass showing encasement in polysaccharide capsule.

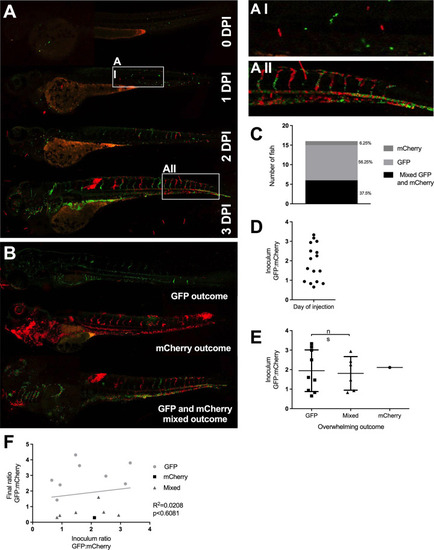
Inoculum does not predict infection outcome.

Infection of 2 dpf AB larvae with 25 cfu of a 5:1 ratio of GFP:mCherry KN99 C. neoformans. Larvae were imaged until 8 dpf, or death (n = 3, in each repeat 7, 10 and 12 larvae were used) A Infection of AB wild-type larvae with 5:1 ratio of GFP:mCherry KN99 C. neoformans, at 0 dpi, 1 dpi, 2 dpi and 3 dpi A I Formation of cryptococcal masses at 1 dpi A II Final infection outcome B Infection of 2 dpf AB larvae with 25 cfu of a 5:1 ratio of GFP:mCherry KN99 C. neoformans. Larvae were imaged until 8 dpf, or death (n = 3, in each repeat 7, 10 and 12 larvae were used). A GFP majority infection outcome, mCherry infection outcome or a Mixed GFP and mCherry infection outcome (n = 3, 16 larvae) C Proportion of each overwhelming infection outcome observed, GFP, mCherry or mixed D Range of GFP:mChery C. neoformans injected into larvae at 2 hpi E Actual injected GFP:mCherry ratios for each overwhelming outcome (n = 3, +/- SEM, Man-Whitney t-test ns = not significant) F Inoculum ratio of GFP:mCherry, against final GFP:mCherry ratio at overwhelming infection stage (Linear regression R2 = 0.0208, p<0.6081, n = 3, 16 larvae).

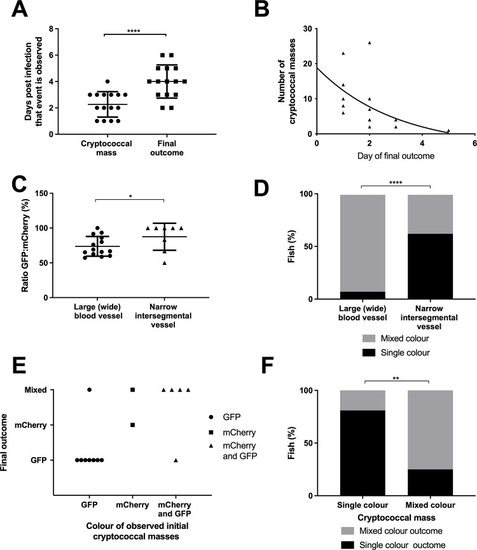
Cryptococcal mass formation leads to uncontrolled infection.

Infection of 2 dpf AB larvae with 25 cfu of a 5:1 ratio of GFP:mCherry KN99 C. neoformans. Larvae were imaged until 8 dpf, or death (n = 3, in each repeat 7, 10 and 12 larvae were used) A Time cryptococcal mass first observed and time of final outcome observed (n = 3, +/- SEM, Wilcoxon matched pairs test, ****p<0.0001) B The maximun number of cryptococcal masss observed within individual larvae and how many days after observation final overwhelming infection was reached (n = 3, non-linear regression, one-phase decay) C The ratio of GFP:mCherry C.neoformans in the large caudal vein in comparison to the fifth intersegmental blood vessel, at uncontrolled infection time point (n = 3, *p<0.05, +/-SEM, paired t-test). D Single or mixed C.neoformans strains in the large caudal vein in comparison to the fifth inter-segmental blood vessel, at uncontrolled infection time point (n = 3, ****p<0.0001, Fischer’s exact test). E Comparison of the colour (either GFP, mCherry or mixed) of C. neoformans in cryptococcal masses found in inter-segmental vessels, in relation to the final outcome majority C. neoformans colour F Comparison of the colour of cryptococcal masss, either single colour or mixed, with the colour of final outcome (n = 3, **p<0.01, Fischer’s exact test).

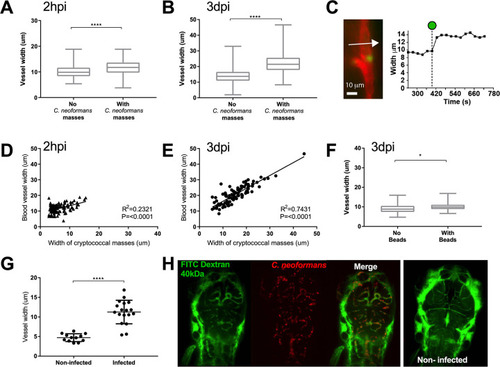
Localised clonal expansion proportionally increases vasculature size.

A-E: Infection of KDRL mCherry blood marker transgenic line with 1000 cfu GFP C. neoformans or inert beads A Inter-segmental vessel width with and without cryptococcal masses at 2 hpi (n = 3, +/- SEM, ****p<0.0001, unpaired t-test) B Inter-segmental vessel with and without cryptococcal masses at 3 dpi (n = 3, +/- SEM, ****p<0.0001, unpaired t-test) C Left panel—Image from a time-lapse movie of KDRL mCherry zebrafish larvae showing a blood vessel (red) in the zebrafish brain and a C. neoformans cell (green). Right panel—graph showing the change in diameter of the blood vessel measured at the point indicated by the white arrow in Ci, at each frame in the time-lapse. The dotted line on the x axis indicates the timepoint where the Cryptococcus cell becomes stuck at the point of measurement (white arrow). D Relationship between C. neoformans mass and vessel width at 2 hpi (n = 3, linear regression) E Relationship between C. neoformans mass and vessel width at 3 dpi (n = 3, linear regression) F Vessel width with and without beads present at 3 dpi (n = 3, +/- SEM, *p<0.05, unpaired t-test). G-H: Inoculation of mCherry C. neoformans with 40kDa FITC Dextran to mark blood vessels G Comparison of infected brain vessels width to non-infected corresponding brain vessels (three infected fish analysed, +/- SEM, ****p<0.0001, paired t-test) H Example image of infected and non-infected brain vessels.

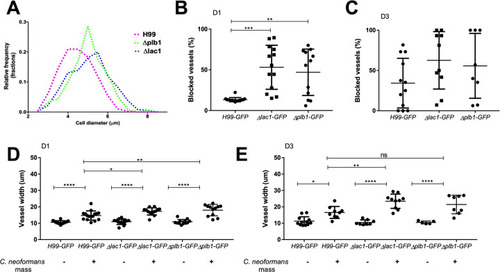
Cryptococcal cell size influences the frequency of trapping within blood vessels.

A-E: Infection of KDRL mCherry blood marker transgenic line with 1000 cfu Δplb1-H99, Δlac1-H99 or parental H99-GFP C. neoformans A Size of cryptococcal cells injected into zebrafish larvae on the day of infection (>300 cryptococcal cells measured per strain) B Blocked vessels (% of all inter-segmental vessels) at 1 dpi (n = 2, +/- SD, **p<0.01, Kruskal-Wallis test) C Blocked vessels (% of all inter-segmental vessels) at 3 dpi (n = 2, +/- SD, Kruskal-Wallis test) D Vessel width with or without C. neoformans at 1 dpi (n = 2, +/- SD, ns = not significant, **p<0.01, ****p<0.0001, Kruskal-Wallis test) E Vessel width with or without C. neoformans at 3 dpi (n = 2, +/- SD, ns = not significant, *p<0.05, ****p<0.0001, Kruskal-Wallis test).

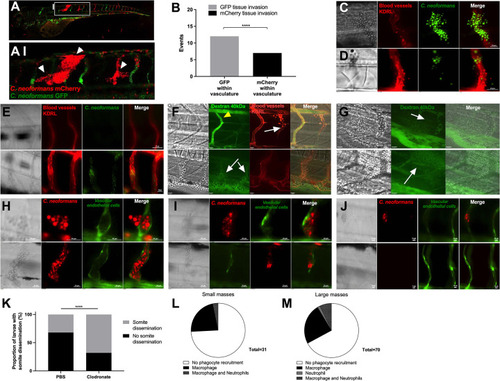
Dissemination events through vasculature damage.

A-B Infection of 2 dpf AB larvae with 25 cfu of a 5:1 ratio of GFP:mCherry KN99 C. neoformans. Larvae were serieally imaged until 8 dpf, or death A-AI white arrow heads indicate examples of dissemination of C. neoformans (mCherry) into the somite surrounding an existing mCherry cryptococcal mass B Comparison of colour of C. neoformans in the vasculature (GFP or mCherry), and the corresponding colour of dissemination events at the same location (19 events in total) C, D and E Infection of KDRL mCherry blood marker transgenic line at 2 dpf with 1000 cfu GFP C. neoformans C Dissemination from an intact blood vessel, with C. neoformans in the surrounding tissue suggested to be transcytosis D Damaged blood vessels with C. neoformans in surrounding tissue E Intact blood vessels (KDRL marker) with or without C. neoformans F-G Infection of KDRL mCherry blood marker transgenic line at 2 dpf with 1000 cfu C. neoformans and then injection of 40kDa FITC Dextran (green) at 5 dpf immediately before imaging F yellow arrowhead indicates dextran within unblocked inter-segmental vessel, white arrows indicate cryptococcal masses within inter-segmental vessels which do not have dextran within. G white arrows indicate sites of dextran leakage into surrounding somite next to cryptococcal dissemination events. H-J Infection of vascular-endothelium cadherin endothelial junction (blood vessel marker) transgenic line with 1000 cfu mCherry C. neoformans H Intact blood vessel endothelial layer, with C. neoformans in the surrounding tissue I Damage in the blood vessel endothelial layer J Intact blood vessels with or without C. neoformans K Proportion of larvae developing cryptococcal somite growths by 3 dpi, infected with 500 cfu H99-GFP C. neoformans with clodronate liposome or PBS-control treatment (n = 3, groups of 92 and 145 larvae). L-M Infection of Tg(mpeg1:mCherry.CAAX)sh378 stably crossed to Tg(mpx:eGFP)i114 larvae at 2 dpf with 1000 cfu KN99 C. neoformans imaged at 3 dpi L The number of small cryptococcal masses (up to 4 cryptococcal cells) with macrophage, neutrophil, both or no phagocyte recruitment (n = 3, 26 larvae) M The number of larger cryptococcal masses (over 4 cryptococcal cells) with macrophage, neutrophil, both or no phagocyte recruitment (n = 3, 26 larvae). In this figure images of vessels show a single plane of a 50 μm stack.

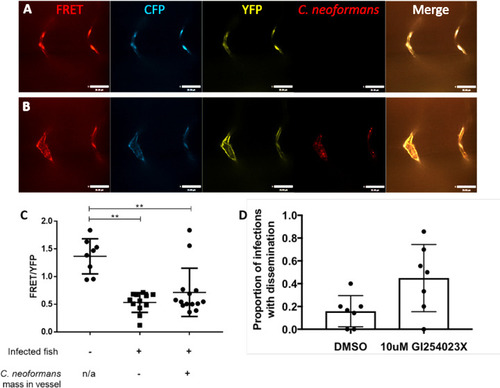
Cryptococcal infection leads to increased tension across VE-cadherin.

A-C Infection of FRET tension reporter (VE-cadherin-TS) transgenic zebrafish line with 1000 cfu mCherry C. neoformans A-B FRET = YFP signal via FRET with excitation of CFP, CFP = CFP signal with direct excitation of CFP, YFP = YFP signal with direct excitation of YFP. A images of non-infected control vessels B Image showing infected fish, vessel containing a mass (left) and a vessel without a mass (right) C FRET analysis of infected fish with or without masses and non-infected controls larvae (n = 2, 4–7 larvae per repeat, +/- SD, **p<0.01, Kruskal-Wallis test, where vessel fluorescence was measured at each side of vessel) D Proportion of infected fish with disseminated infection. 7 repeats, 10 zebrafish larvae per repeat per group. P = 0.036 unpaired t-test.

Acknowledgments
This image is the copyrighted work of the attributed author or publisher, and ZFIN has permission only to display this image to its users. Additional permissions should be obtained from the applicable author or publisher of the image. Full text @ PLoS Pathog.