FIGURE SUMMARY
Title

Characterization of a novel zebrafish model of SPEG-related centronuclear myopathy

Authors
Espinosa, K.G., Geissah, S., Groom, L., Volpatti, J., Scott, I.C., Dirksen, R.T., Zhao, M., Dowling, J.J.
Source
Full text @ Dis. Model. Mech.

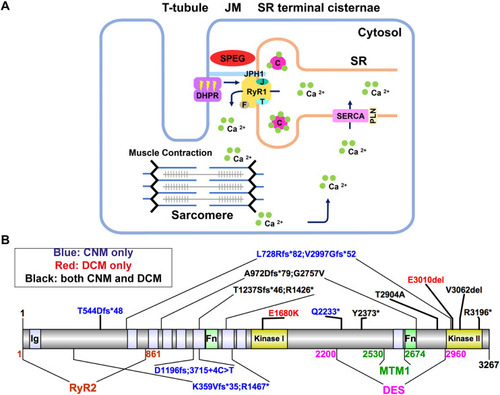
Schematic diagrams of excitation–contraction coupling (ECC) at the triad, and SPEG domains and pathogenic variants. (A) The triads are made of transverse tubules (T-tubules) flanked by terminal cisternae of the sarcoplasmic reticulum (SR). Junctional membranes (JM) are connected by the interaction of the ryanodine receptor (RyR1) at the SR, and dihydropyridine receptor (DHPR) at the T-tubules, forming the core components of the ECC machinery. ECC starts when a neuronal action potential arrives via T-tubules and causes a conformational change in DHPR, allowing it to interact with RyR1, leading to its activation. As a result, calcium (Ca2+) leaves the SR via RyR1 channel opening and moves into the cytosol, promoting sarcomeric contraction. Finally, RyR1 is closed and the Ca2+ transporter sarco/endoplasmic reticulum Ca2+-ATPase [SERCA; also known as ATP2A; regulated by phospholamban (PLN)] returns Ca2+ into the SR, where it is largely bound to calsequestrin (C). The terminal SR also contains RyR1 modulators, such as junctophilin-1 (JPH1), FK506-binding protein 1A (F), junctin (J) and triadin (T). Striated muscle enriched protein kinase (SPEG) is localized at the triad, but its role remains elusive. (B) SPEG contains immunoglobulin domains (Ig; light purple shaded), fibronectin domains (Fn; light green shaded) and two kinase domains (yellow shaded). SPEG directly binds to myotubularin 1 (MTM1; dark green; SPEG 2530-2674 a.a.) (Agrawal et al., 2014) and desmin (DES; magenta; SPEG 2200-2960 a.a.) (Luo et al., 2020) at the inter-kinase domain. Pathogenic variants in SPEG span different regions of the gene and are typically nonsense mutations that result in decreased SPEG levels. The variants exist either in compound heterozygosity (e.g. K359Vfs*35; R1467*), or homozygosity (e.g. T544Dfs*48). SPEG mutations can cause a skeletal muscle disorder only (i.e. centronuclear myopathy or CNM, blue font), a cardiomyopathy only (e.g. dilated cardiomyopathy, red font) or both (black font), with no clear genotype–phenotype correlation. Note that patient Q2233* died before a cardiac evaluation. Illustrations were made using Illustrator for Biological Sciences (IBS) (Liu et al., 2015).

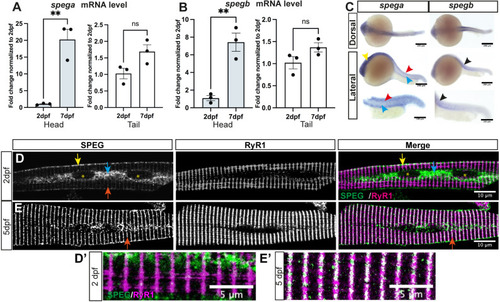
Speg expression during zebrafish development. There are two Speg genes in zebrafish, spega and spegb. Each encodes a single transcript that is highly conserved with human SPEG. (A,B) RT-qPCR shows similar temporal expression patterns of spega (A) versus spegb (B) from 2 days post-fertilization (dpf) to 7 dpf. Both Speg mRNA transcripts are significantly upregulated in the heads (light blue bars; 20-fold for spega, 7-fold for spegb), but stay at relatively similar levels in the skeletal-muscle-predominant tails (white bars). Each data point represents the average of technical triplicates, and three independent experiments are included. Columns and error bars represent mean±s.e.m. Unpaired two-tailed Student's t-test was performed: **P<0.01; ns, not significant. (C) Whole-mount in situ hybridization using DIG-conjugated RNA probes in 1 dpf embryos shows distinct spatial expression patterns of spega versus spegb. spega is predominantly expressed in the developing brain (yellow arrowhead) and along the neural tube (red arrowheads), but absent from the notochord (cyan arrowheads). spegb staining, however, is predominantly detected at the chevron-shaped developing somites (black arrowheads). Scale bars: 200 µm (top and middle rows) or 100 µm (bottom row). (D,E) Confocal images showing 2 dpf (D) or 5 dpf (E) isolated wild-type (WT) skeletal myofibers double-stained with anti-RyR1 (34C, DSHB) and anti-SPEG (PA553875, Invitrogen). (D,D′) At 2 dpf, SPEG is predominantly localized at the sarcolemma (yellow arrows) and perinuclear regions (cyan arrows; nucleus, yellow asterisks), with weak expression in transverse striations (red arrow), whereas RyR1 is localized in transverse striations labeling the terminal SR. Little colocalization (white in Merge) of SPEG (green) and RyR1 (magenta) can be observed at this stage. (E,E′) At 5 dpf, SPEG expression becomes restricted in the transverse striations (red arrows) that overlap with RyR1. Scale bars: 10 µm (D,E); 5 µm (D′,E′).

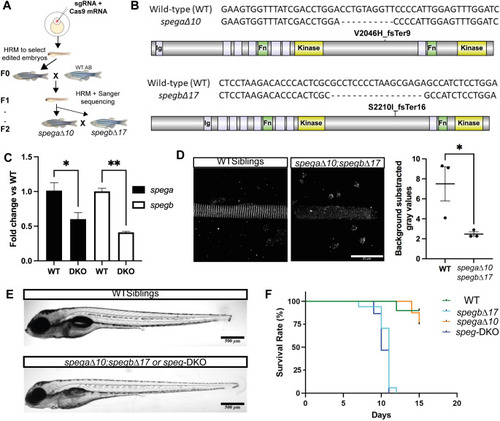
Generation of spega/b knockout zebrafish. (A) Schematic diagram showing the workflow of generating Speg single and double CRISPR-Cas9 mutants. gRNAs (against spega or spegb) showing high editing efficiency [as determined by high-resolution melting (HRM)] were co-injected with Cas9 mRNA into one-cell-stage embryos (AB strain), and the resulting larvae were raised to adulthood. These F0 zebrafish were then outcrossed to WT AB, and resulting embryos screened for germline mutation by HRM and Sanger sequencing. Larvae that showed nucleotide changes leading to premature stop codons were raised to adulthood (F1), i.e. spega single KO (spegaΔ10) or spegb single KO (spegbΔ17). To dilute off-target effects, F1 adults were outcrossed to AB WTs to generate F2 embryos and adults. Double KO lines (e.g. spegaΔ10;spegbΔ17) were then generated by crossing spega F2 heterozygous (+/−) adults to spegb F2 heterozygous (+/−) adults. (B) Genotypes and predicted protein products (if any) of the single mutant lines. spega-V2046H_fsTer9: V2046>H, frame shift and terminates nine amino acids downstream. spegb-S2210I_fsTer16: S2210>I, frame shift and terminates 16 amino acids downstream. (C) RT-qPCR analysis shows significant reductions (∼50%) in both spega (black bars) and spegb (white bars) mRNA transcript levels in spegaΔ10;spegbΔ17. Unpaired two-tailed Student's t-test: *P<0.05, **P<0.01. (D) Quantification of Speg protein levels as measured by immunofluorescence (IF; anti-Speg) intensity in 5 dpf myofibers isolated from WT siblings versus spegaΔ10;spegbΔ17. Each dot represents the average of gray values (technical triplicates) measured by the square tool in Fiji ImageJ. Three independent experiments were performed, and data are shown as mean±s.e.m. Unpaired two-tailed Student's t-test: *P<0.05. Scale bar: 25 µm. (E) At 6 dpf, morphology was similar between WT siblings and spegaΔ10;spegbΔ17 (or speg-DKO), although deflated swim bladder was noted in speg-DKOs. Scale bars: 500 µm. (F) Representative Kaplan–Meier curve showing reduced survival in spegbΔ17 (spega +/+; spegb-KO, light blue) and speg-DKO (spega-KO; spegb-KO, dark blue), but not in spegaΔ10 (spega-KO; spegb +/+, orange) or WT siblings (spega +/+; spegb +/+, green). spegb-KO and speg-DKO larvae have a median survival of 11 dpf and 10 dpf, respectively, and a maximum survival of 12 dpf and 11 dpf, respectively. n=10 WT, n=17 spegb-KO, n=16 spega-KO and n=15 speg-DKO. Mantel–Cox test.

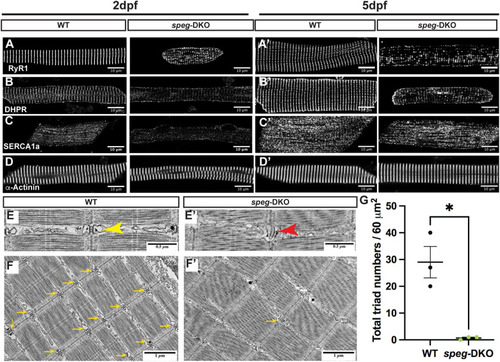
spega/b deficiency in zebrafish disrupts triad protein organization and triad ultrastructure, leading to reduced triad numbers. (A-D′) IF staining was performed on 2 dpf (A,B,C,D) and 5 dpf (A′,B′,C′,D′) isolated myofibers. Confocal images show disrupted transverse pattern of RyR1 (A,A′), DHPR (B,B′) and SERCA1a (D,D′) in speg-DKO starting from 2 dpf, while α-Actinin (D,D′) is not affected. Scale bars: 50 µm. (E-F′) Electron micrographs of 7 dpf WT and speg-DKO muscles. (E) In WT zebrafish skeletal muscle, normal triads are physically above the sarcomeric Z-disks and composed of centrally-located T-tubules flanked by terminal sarcoplasmic reticulum (yellow arrowhead). (E′) Triads in speg-DKO appear structurally disrupted, losing the obvious terminal cisternae of the sarcoplasmic membrane (tSR)/T-tubule/tSR pattern (red arrowhead). (F,F′) More importantly, the majority of sarcomeric Z-disks in speg-DKO do not have adjacent triads (yellow arrows). Scale bars: 0.5 µm (E,E′); 1 µm (F,F′). (G) The total number of triads per 60 µm2 (under an electron microscope) was significantly reduced in speg-DKO. Each dot represents the average of technical triplicates, and three biological replicates are included. Data are mean±s.e.m. Unpaired two-tailed Student's t-test: *P<0.05.

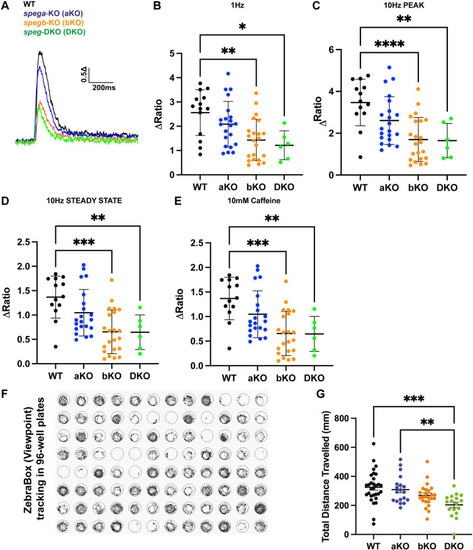
spega/b deficiency in zebrafish disrupts ECC in isolated myofibers and impairs overall muscle performance. (A-E) Cytosolic Ca2+ transients in 7 dpf isolated myofibers were measured using a Ca2+-sensitive dye fluo-4-AM. (A) A representative diagram of Ca2+ transient traces. (B-E) Five-twitch 1 Hz stimulations (B) were followed by one 10 Hz stimulation (C,D) and 30 s of 10 mM caffeine (E). Overall, spegb-KO (bKO) and speg-DKO (DKO) showed significantly reduced ECC compared to WT and spega-KO (aKO). (F) A representative image of swim trace tracking using ZebraBox in a 96-well plate setting, by which total distance traveled (mm) was quantified for each 3 dpf zebrafish per well. (G) Both spegb-KO and speg-DKO swam significantly less distance than WT and spega-KO. All statistical analyses include three independent experiments: for fluo-4-AM experiments (B-E), each dot represents one myofiber, at least n=5 myofibers per group per experiment; for swimming assay (G), each dot represents a 3 dpf zebrafish, at least n=5 zebrafish per group per experiment. Data are mean±s.e.m. One-way ANOVA: *P<0.05; **P<0.01; ***P<0.001; ****P<0.0001. WT, black line or dots; aKO, blue line or dots; bKO, orange line or dots; DKO, green line or dots.

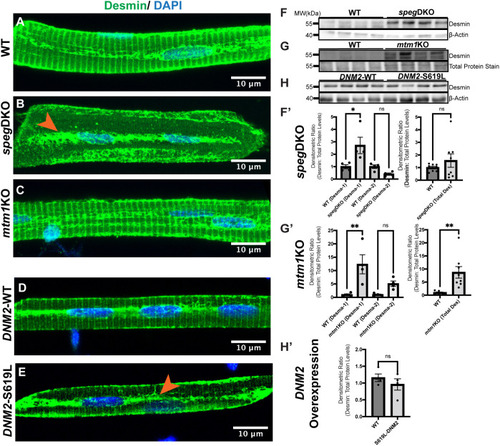
Desmin subcellular localization and protein levels in zebrafish models of CNM. (A-D) Myofibers were isolated at 5 dpf (speg-DKO), 7 dpf (mtm1-KO) and 3 dpf (DNM2 overexpression), and stained with anti-Desmin (green; D8281, Sigma-Aldrich) and DAPI (blue, nucleus). (A) At 5 dpf, Desmin is normally localized to the sarcolemma, perinucleus and the sarcomeric Z-disks (as transverse striations). (B) In speg-DKO (5 dpf), Desmin is predominantly localized to the perinucleus (orange arrowhead). (C) In mtm1-KO (7 dpf), Desmin localization appears similar to that of WT siblings. (D,E) WT DNM2-EGFP-overexpressing myofibers show similar Desmin staining pattern to that of non-transgenic WTs (D), while DNM2-S619L DNM2-EGFP-overexpressing myofibers show loss of Desmin in transverse striations, with Desmin localization predominantly at the perinucleus (orange arrowhead) (E). Scale bars: 10 µm. (F-H′) Western blot analysis using whole-zebrafish lysates shows Desmin upregulation in 5 dpf speg-DKO (by 2- to 3-fold) (F,F′) and in 7 dpf mtm1-KO (by 5- to 10-fold) (G,G′) compared to WT siblings, but not in 3 dpf DNM2-S619L zebrafish (H,H′) compared to DNM2-WT controls. Each lane (F,G,H) or each dot (F′,G′,H′) represents n=25 zebrafish (40 µg of total proteins), four lanes represent four independent experiments. Densitometry was measured using Fiji ImageJ. Desmin protein levels were normalized to β-actin loading controls in speg-DKO and DNM2, or to REVERT total protein stains in mtm1-KO (as β-actin level is changed by the lack of Mtm1). Data are mean±s.e.m. Unpaired two-tailed Student's t-test: *P<0.05; **P<0.01; ns, not significant.

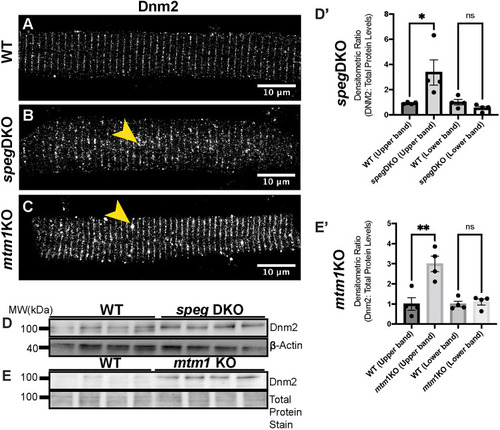
Dnm2 protein is upregulated in both speg-DKO and mtm1-KO zebrafish. (A-C) Myofibers were isolated at 5 dpf (speg-DKO) and 7 dpf (mtm1-KO), and stained with anti-Dnm2 (GTX127330, GeneTex). (A) In WT myofibers (5 dpf), Dnm2 is localized to the triads (transverse striations). (B,C) Similar striated patterns can be observed for Dnm2 in speg-DKO (B) and mtm1-KO (C), with occasional Dnm2 aggregations observed along the striations (yellow arrowheads). Scale bars: 10 µm. (D-E′) Western blot analysis shows increased Dnm2 protein levels in 5 dpf speg-DKO (D,D′) and 7 dpf mtm1-KO (E,E′) compared to WT. Each lane (D,E) or each dot (D′,E′) represents n=25 zebrafish (40 µg total protein). Densitometry was accomplished using Fiji ImageJ. Dnm2 protein level was normalized to β-actin loading controls in speg-DKO, or to REVERT total protein stains in mtm1-KO (as β-actin level is changed by the lack of Mtm1). Student's t-test: *P<0.05; **P<0.01; ns, not significant.

Acknowledgments
This image is the copyrighted work of the attributed author or publisher, and ZFIN has permission only to display this image to its users. Additional permissions should be obtained from the applicable author or publisher of the image. Full text @ Dis. Model. Mech.