FIGURE SUMMARY
Title

Long descending commissural V0v neurons ensure coordinated swimming movements along the body axis in larval zebrafish

Authors
Kawano, K., Kato, K., Sugioka, T., Kimura, Y., Tanimoto, M., Higashijima, S.I.
Source
Full text @ Sci. Rep.

Swim form of a zebrafish larva and projection of an MCoD neuron. (A) One of the swim forms of a zebrafish larva at 4 to 5 dpf. The cyan circle shows the center of mass, which is located near the swim bladder. Muscle contractions are presumed to occur in the two locations marked in red. (B) Projection pattern of an MCoD neuron in the spinal cord. The axon of the MCoD neuron crosses the midline (broken line), descends on the contralateral spinal cord, and makes mono-synaptic excitatory connections onto caudally located MNs.

Firing pattern of MCoD neurons during spontaneously occurring fictive slow swimming. (A) A schematic illustration of the simultaneous recordings of an MCoD neuron (loose-patch) and ventral root (VR). (B) An example of the recording during spontaneously occurring fictive slow swimming. (C) A close-up view of two swim cycles. For the phase analysis of spike timings, the middle time point of a VR activity was assigned a phase value of 0, and that of the next VR activity was assigned a phase value of 1. The right panel shows a circular plot of 30 randomly selected spikes relative to VR activity during fictive swimming. The direction of the vector (arrow) shows the mean of the phase value, and the length of the vector shows the strength of the rhythmicity. (D) A circular plot showing the spike timing of MCoD neurons (n = 7). The grey circle line marks the 5% significance level.

Ablation of MCoD neurons lead to the increase of head-yaw displacement during spontaneous swimming. (A) Confocal stacked images of Tg[evx2-hs:GFP] fish before (left) and after (right) laser ablation. Images of two hemi-segments are shown. Magenta arrows show MCoD neurons that were chosen for laser ablation. MCoD neurons can be identified by their very ventral location in the spinal cord. Brown lines show boundaries of muscle segments. Scale bar, 20 μm. (B) Successive images captured at 1000 frames per second of larval zebrafish swimming. Images of every three frames (3 ms interval) are shown. Magenta bars depict the head directions in each frame. Top, images of an intact fish. Bottom, images of an MCoD-ablated fish. Scale bar, 500 μm. (C) Graphs of head yaw angle (y axis) versus time (x-axis) during swimming. Left, intact fish. Right, MCoD-ablated fish. (D) Maximum head yaw angle of intact and MCoD-ablated fish during swim bouts. Five fish were examined for each fish type. For each fish, 10 swim bouts were examined. Data obtained from the same fish are color coded. (E) Mean head yaw angle for displacement peaks of intact and MCoD-ablated fish during swim bouts. Five fish were examined for each fish type. For each fish, 10 bouts were examined. Data obtained from the same fish are color coded (the same fish as D). ***p < 0.001 (two-tailed t-test).

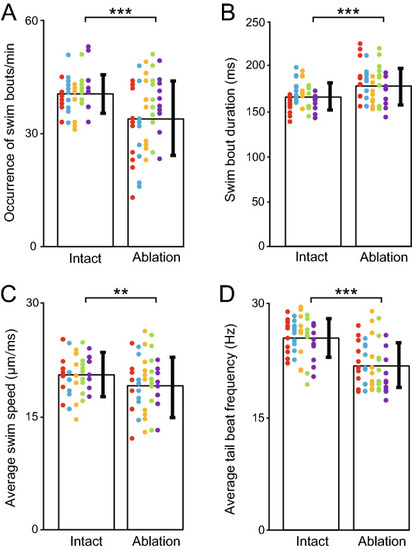
Swim parameters of intact and MCoD-ablated fish. For the analyses of each parameter, five fish were examined for each fish type. For each fish, 10 swim bouts (or a 1-min movie in the case of A) were examined. Data obtained from the same fish are color coded (the same fish as Fig. 3D,E). (A) Occurrence frequency of swim bouts (per minute) of intact and MCoD-ablated fish. (B) Swim bout duration of intact and MCoD-ablated fish. (C) Average swim speed of intact and MCoD-ablated fish. (D) Average tail beat frequency of intact and MCoD-ablated fish. **p < 0.01, ***p < 0.001 (two-tailed t-test).

S-shape swim forms are impaired in MCoD-ablated fish. (A) Examples of typical swim forms of an intact fish (left) and an MCoD-ablated fish (right). Arrowheads in the left panel show presumed muscle-contraction sites. An arrow in the right panel shows a kinked bend near the tail tip, which is likely produced by passive force from the surrounding water. Scale bar, 500 μm. (B) Extractions of the skeletal line representing body shape (red lines). The left panel corresponds to the left panel of (A), and the center panel corresponds to the right panel of (A). The right panel is an image of an intact fish near the end of a swim bout. (C) The skeletal line in (C) is fitted to polylines (cyan lines) consisting of four vertices including head and tail termini. (D) Histograms of the appearance frequencies of “S”, “C”, and “I” forms in the movie frames of intact fish (left) and MCoD-ablated fish (right). ***p < 0.001 (two-tailed t-test).

Anti-phasic relationship of the rostral and caudal motor activities is impaired in MCoD-ablated fish. (A) Left panel, An example of the dual (rostral and caudal) VR recordings. For the phase analysis, the middle time point of a rostral VR activity was assigned a phase value of 0, and that of the next VR activity was assigned a phase value of 1. Right panel, Circular plot of 20 randomly selected caudal VR activities with respect to rostral VR activity during fictive swimming. (B) Same as (A) but for MCoD-ablated fish. (C) Left panel, Circular plot for the recordings from intact fish (n = 8). Right panel, Circular plot for the recordings from MCoD-ablated fish (n = 5).

Acknowledgments
This image is the copyrighted work of the attributed author or publisher, and ZFIN has permission only to display this image to its users. Additional permissions should be obtained from the applicable author or publisher of the image. Full text @ Sci. Rep.