FIGURE SUMMARY
Title

ALKBH3-dependent m1A demethylation of Aurora A mRNA inhibits ciliogenesis

Authors
Kuang, W., Jin, H., Yang, F., Chen, X., Liu, J., Li, T., Chang, Y., Liu, M., Xu, Z., Huo, C., Yan, X., Yang, Y., Liu, W., Shu, Q., Xie, S., Zhou, T.
Source
Full text @ Cell Discov

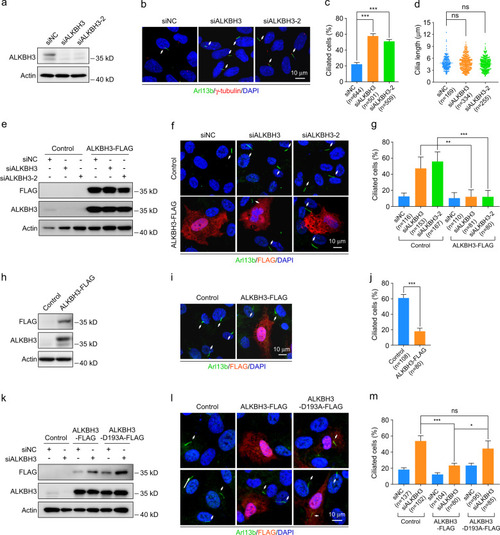
ALKBH3 inhibits ciliogenesis through its m<sup>1</sup>A demethylation activity.

ad RPE-1 cells were transfected with control or ALKBH3 siRNAs for 48 h in DMEM/F12 medium with 10% serum (normal conditions) and then subjected to western analysis or immunofluorescence. Western blotting of ALKBH3 protein (a). Representative images of RPE-1 cells with anti-Arl13b (green) and γ-tubulin (red) antibodies (b). Quantification analysis of the percentage of ciliated cells (c). Cilia length was determined by Image J software (d). eg, km RPE-1 cells treated with the indicated siRNAs for 24 h were transfected with control, ALKBH3-FLAG, or ALKBH3-D193A-FLAG plasmid for another 24 h in normal conditions, and then subjected to western analysis or immunofluorescence. hj RPE-1 cells transfected with the indicated plasmids for 24 h in normal conditions were treated with serum starvation for another 24 h and then applied for western analysis or immunofluorescence. Western blotting of FLAG and ALKBH3 protein was presented (e, h, k). Representative confocal images of RPE-1 cells with anti-Arl13b (green) and anti-FLAG (red) antibodies were shown (f, i, l). The percentage of ciliated cells in control or FLAG-positive group was analyzed (g, j, m). Actin was served as a loading control. DNA was stained by DAPI (blue). Cilia are indicated by white arrows. Scale bars, 10 μm. n, the number of total cells calculated. Data are presented as the means ± SD from at least three independent experiments. Student’s t-test; ns not significant; *P < 0.05, **P < 0.01, ***P < 0.001.

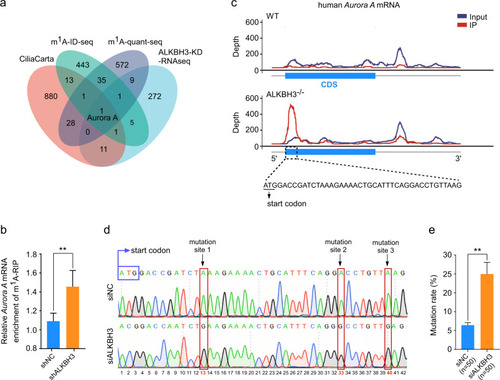
ALKBH3 removes m<sup>1</sup>A sites on <italic>Aurora A</italic> mRNA.

a Venn diagram showing the overlapped transcripts from the databases of CiliaCarta, m1A-ID-seq, m1A-quant-seq, and RNA-seq in ALKBH3-KD cells. KD, knockdown. b Cells infected with lentivirus carrying shRNA targeting negative control (NC) or ALKBH3 were subjected to m1A RNA immunoprecipitation-qPCR analysis (m1A-RIP). m1A levels of Aurora A mRNA in control and ALKBH3-depleted cells were measured. c Peak-calling analysis of specific m1A peaks of Aurora A mRNA in wild-type and ALKBH3 knockout HEK-293T cells. d Sanger sequencing of Aurora A PCR products amplified from cDNAs that were reverse-transcripted by RT-1306 in the control and ALKBH3-depleted cells. Mutations at the m1A site are highlighted with red box. e Mutation rates at m1A sites of Aurora A mRNA in the indicated group are shown. Data are presented as the means ± SD from at least three independent experiments. Student’s t-test; **P < 0.01.

Knockdown of ALKBH3 attenuates the stability and translation of <italic>Aurora A</italic> mRNA.

a Western blotting analysis of ALKBH3 in RPE-1 cells treated with the indicated siRNAs. Actin was used as a loading control. b Quantitative real-time PCR (qRT-PCR) analysis of Aurora A in RPE-1 cells transfected with the indicated siRNAs. GAPDH was served as an internal control. c Quantitative RT-PCR of Aurora A mRNA in ALKBH3-depleted and control cells treated with actinomycin D (5 μg/mL) at the indicated times. dg Western blotting of Aurora A in RPE-1 cells transfected with the siRNAs or plasmids as shown. Actin, a loading control. The intensity of Aurora A was measured based on the normalization to Actin. h Western blotting analysis of ALKBH3 and Aurora A in RPE-1 cells infected with lentivirus carrying shRNA targeting ALKBH3. Actin was used as a loading control. NC, negative control. i Polysome profiling of Aurora A mRNA in cells infected with lentivirus carrying shRNA targeting ALKBH3 after sucrose gradient centrifugation. Data are shown as the means ± SD from at least three independent experiments. Student’s t-test; ns, not significant; *P < 0.05, **P < 0.01, ***P < 0.001.

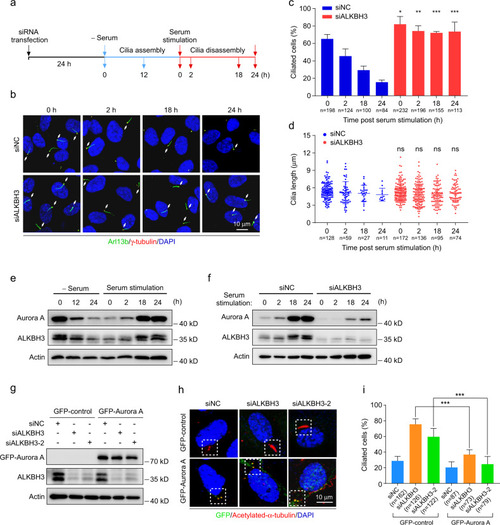
Ectopic expression of Aurora A reverses the ciliary defects in ALKBH3-depleted cells.

af RPE-1 cells transfected with the indicated siRNAs or not were treated with serum starvation for 24 h and serum stimulation for another 24 h, and then subjected to the following analyses at the indicated time points. Schematic illustration of experimental strategy used for the cilia assembly and disassembly experiments (a). Representative confocal images of RPE-1 cells with anti-Arl13b (green) and γ-tubulin (red) antibodies (b). Cilia are indicated by white arrows. Quantification analysis of the percentage of ciliated cells (c). Cilia length was determined by Image J software (d). Western blotting analysis of Aurora A and ALKBH3 proteins at the indicated time points (e, f). Actin was served as a loading control. gi RPE-1 cells treated with the indicated siRNAs for 24 h, followed by infection with lentivirus carrying GFP-control or GFP-Aurora A for another 48 h in normal conditions, and then subjected to western analysis or immunofluorescence. Western blotting of GFP-Aurora A and ALKBH3 protein. Actin, a loading control (g). Representative confocal images of RPE-1 cells with anti-GFP (green) and anti-acetylated-α-tubulin (red) antibodies (h). The percentage of ciliated cells in GFP-control or GFP-Aurora A-positive group (i). DNA was stained by DAPI (blue). Scale bars, 10 μm. n, the number of total cells calculated. Data are shown as the means ± SD from at least three independent experiments. Student’s t-test; ns, not significant; *P < 0.05, **P < 0.01, ***P < 0.001.

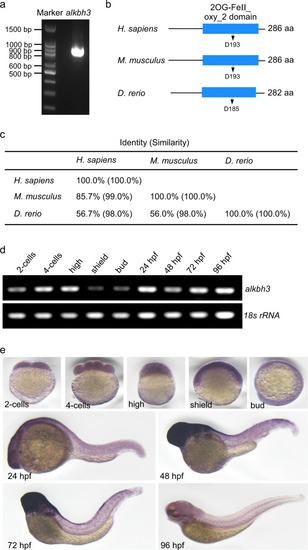
Molecular characterization of zebrafish <italic>alkbh3</italic> gene.

a Cloning of zebrafish alkbh3 by reverse transcription PCR. b, c Schematic comparison of ALKBH3 amino acid sequences from the indicated species. The conserved 2OG-Fe (II) oxygenase superfamily domains are shown in blue filled bars. The conserved amino acid residues D193 and D185 are indicated, respectively. d Reverse transcription PCR analysis of alkbh3 mRNA at the different embryonic stages in zebrafish. 18s rRNA was served as a loading control. e Whole-mount in situ hybridization of zebrafish alkbh3 mRNA at the indicated developmental stages in lateral view.

EXPRESSION / LABELING:
Gene:
Fish:
Anatomical Terms:
Stage Range: 2-cell to Day 4

Zebrafish <italic>alkbh3</italic> morphants exhibit ciliary phenotypes.

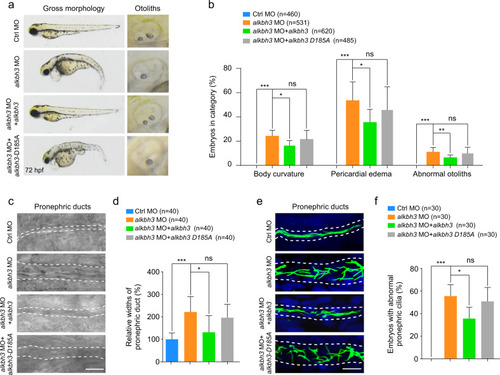
Zebrafish embryos were injected with control morpholino (ctrl MO) or alkbh3 translation-block morpholino (alkbh3 MO) at 1-cell stage and subjected to the following analyses. a, b Bright-field micrographs and statistical analysis of the ciliary phenotypes in alkbh3 morphants. c, d Representative images, and quantification of pronephric ducts in the indicated groups. The lumen of pronephric ducts is indicated by white dashed lines. Scale bar, 10 μm. The widths of pronephric ducts in the indicated groups are measured and the median width of control morphants’ ducts was set at 100%. e Immunostaining of cilia in pronephric ducts in morphants. Cilia were stained by anti-acetylated-α-tubulin antibody (green). The lumen of pronephric ducts is indicated by white dashed lines. Scale bar, 10 μm. f Quantification of embryos with abnormal pronephric cilia. n, the total number of embryos in all experiments. Data are shown as the means ± SD from at least three independent experiments. Student’s t-test; ns, not significant; *P < 0.05, **P < 0.01, ***P < 0.001.

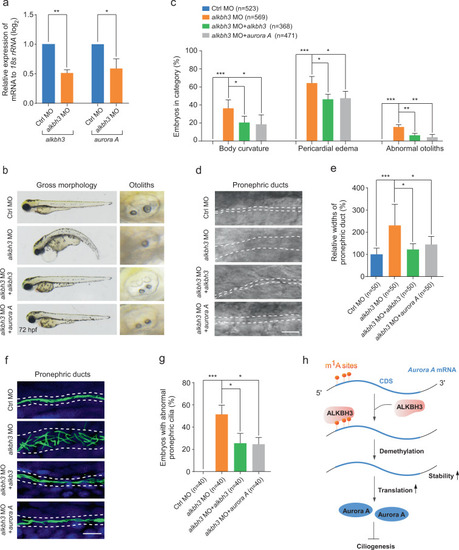
Zebrafish embryos were injected with the indicated MOs or mRNAs at 1-cell stage and subjected to the following assays. a Quantitative RT-PCR of aurora A mRNA levels in alkbh3 morphants at 48 hpf. b, c Representative images and quantification of gross morphology of embryos injected with the indicated MOs or mRNAs. d, e Brightfield images and statistical analyses of zebrafish pronephric ducts. The lumen of pronephric ducts is indicated by white dashed lines. The median width of control morphants’ ducts was set at 100%. f Immunofluorescence of cilia in pronephric ducts. Cilia were stained by anti-acetylated-α-tubulin antibody (green). The lumen of pronephric ducts is indicated by white dashed lines. Scale bar, 10 μm. g The percentage of embryos with abnormal pronephric cilia. Data are presented as the means ± SD from at least three independent experiments. Student’s t-test; *P < 0.05, **P < 0.01, ***P < 0.001. h Working model of ALKBH3-dependent m1A demethylation of Aurora A mRNA to inhibit ciliogenesis. See text for details.

EXPRESSION / LABELING:
Gene:
Fish:
Knockdown Reagent:
Anatomical Term:
Stage: Long-pec
PHENOTYPE:
Fish:
Knockdown Reagent:
Observed In:
Stage: Long-pec
Acknowledgments
This image is the copyrighted work of the attributed author or publisher, and ZFIN has permission only to display this image to its users. Additional permissions should be obtained from the applicable author or publisher of the image. Full text @ Cell Discov