ZFIN is incorporating published figure images and captions as part of an ongoing project. Figures from some publications have not yet been curated, or are not available for display because of copyright restrictions.

EXPRESSION / LABELING:
Genes:
Fish:
Anatomical Term:
Stage: Bud
PHENOTYPE:
Fish:
Observed In:
Stage: Bud

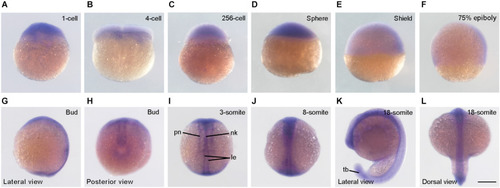
Expression pattern of syne2b during early development. (A–D) At cleavage and blastula stages, syne2b transcripts are enriched in the blastodisc. Animal pole region is on the top. (E,F) Predominant expression of syne2b in the dorsal region during gastrulation. Lateral view with animal pole region on the top and dorsal region to the right. (G,H) Expression of syne2b along the anteroposterior axis at bud stage. (I,J) Dorsal views show syne2b expression in axial structures, including neural keel (nk), lateral edges (le) of neural keel and primary neurons (pn). (K,L) Expression of syne2b in the neural tissue and tail bud (tb). Scale bar: (A–L) 200 μm.

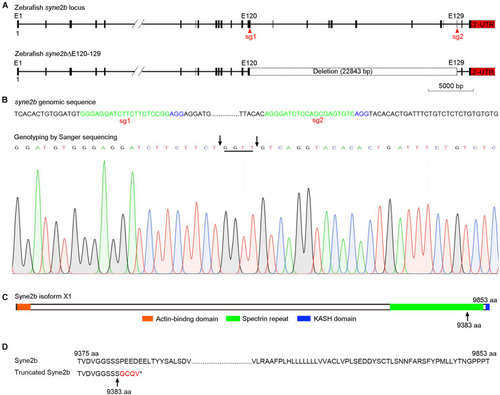
Generation of syne2b mutation by CRISPR/Cas9-mediated genome editing. (A) Organization of the zebrafish syne2b locus. Shown are the sgRNA targeting sites (sg1 and sg2) and the deleted intervening region. (B) Genotyping of syne2b mutation. The sgRNA recognition sequences are green colored, and the PAM regions are shown in blue. Arrows indicate the positions of deletion in exons 120 and 129. Nucleotides inserted as a result of DNA repair are underlined. (C) Syne2b protein domains. Arrow indicates the position after which truncation occurs in the translated Syne2b protein. (D) Alignment of the C-terminal regions from wild-type and truncated Syne2b proteins. Residues translated after frameshift are indicated in red.

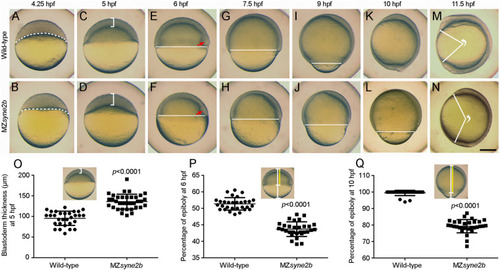
Disruption of Syne2b function impairs epiboly movement and anteroposterior axis elongation. Live images show epiboly initiation and progression in time-matched embryos. Lateral views with animal pole or anterior region on the top. (A,B) At 4.25 hpf, yolk cell domes into the blastoderm in wild-type embryos, while the border between the blastoderm and the yolk cell (broken lines) remains flat in MZsyne2b embryos. (C,D) At 5 hpf, the blastoderm in MZsyne2b embryos is thicker compared with wild-type embryos (brackets). (E,F) At 6 hpf, MZsyne2b embryos show delayed epiboly compared with wild-type embryos (horizontal lines). Red arrows indicate the embryonic shield. (G–J) At 7.5 and 9 hpf, delayed epiboly progression is evident in MZsyne2b embryos. (K,L) At 10 hpf, wild-type embryos complete gastrulation, whereas MZsyne2b embryos only reach about 80% epiboly. (M,N) At 11.5 hpf, wild-type embryos develop a long anteroposterior axis, while MZsyne2b embryos only complete gastrulation. The angle formed between the most anterior end and the most posterior end of the anteroposterior axis, with vertex at the geometric center of the embryo, reflects the extent of axis elongation. (O) Scatter plot compares blastoderm thickness between wild-type and MZsyne2b embryos. (P,Q) Scatter plots compare epiboly progression between wild-type and MZsyne2b embryos. Scale bars: (A–N) 200 μm.

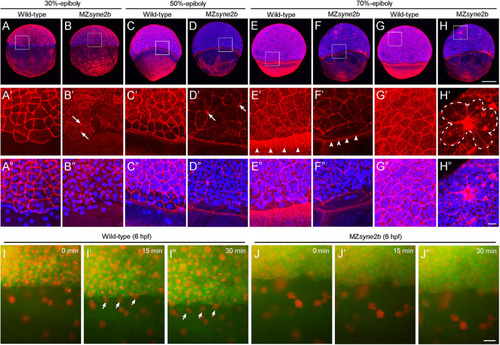
Disruption of Syne2b function affects F-actin organization, EVL cell shape and YSN movements. Phalloidin and DAPI staining of stage-matched embryos. (A–A″) Wild-type embryos at 30% epiboly show strong phalloidin staining in the cortex of EVL cells. A ring of YSN are apparent at the EVL margin. (B–B″) MZsyne2b embryos at 30% epiboly show reduced and clustered (arrows) phalloidin staining in EVL cells. Few YSN are present at the EVL margin. (C–C″) In wild-type embryos at 50% epiboly, phalloidin staining is present strongly in the cortex of EVL cells and uniformly in the yolk cell. YSN are still present at the EVL margin. (D–D″) In MZsyne2b embryos at 50% epiboly, phalloidin staining is clustered at multiple cell contact regions in the blastoderm (arrows) and is disrupted in the yolk cell. Few YSN are scattered in the yolk cell. (E–E″) In wild-type embryos at 70% epiboly, thick actin rings are formed around the blastoderm margin (arrowheads). (F–F″) MZsyne2b embryos at 70% epiboly form weak and thin marginal actin rings (arrowheads). YSN remain scattered in the yolk cell. (G–G″) Regular cortical F-actin and cell shape in the blastoderm of wild-type embryos. (H–H″) Severely disrupted cell shape and rearrangements in the blastoderm of MZsyne2b embryos, with the occurrence of rosette structures (broken lines). (I,J″) Still frames from time-lapse imaging show YSN movements at 50% epiboly. Note that YSN emerge from the front of the EVL margin during epiboly in wild-type embryos (arrows). Scale bars: (A–H) 200 μm; (A′–H″) 20 μm; (I–J″) 100 μm.

Acknowledgments
This image is the copyrighted work of the attributed author or publisher, and ZFIN has permission only to display this image to its users. Additional permissions should be obtained from the applicable author or publisher of the image. Full text @ Front Cell Dev Biol